Download
1 / 23
230 likes | 232 Vues
This research aims to develop a method for evaluating Clean Development Mechanism (CDM) activities in Asian countries by integrating energy system models and life-cycle assessment models. The method considers the potential of CDM credits and cost-benefit analysis, including co-benefits. The study focuses on supply-side energy technologies and their potential for GHG reduction and co-benefits.

E N D
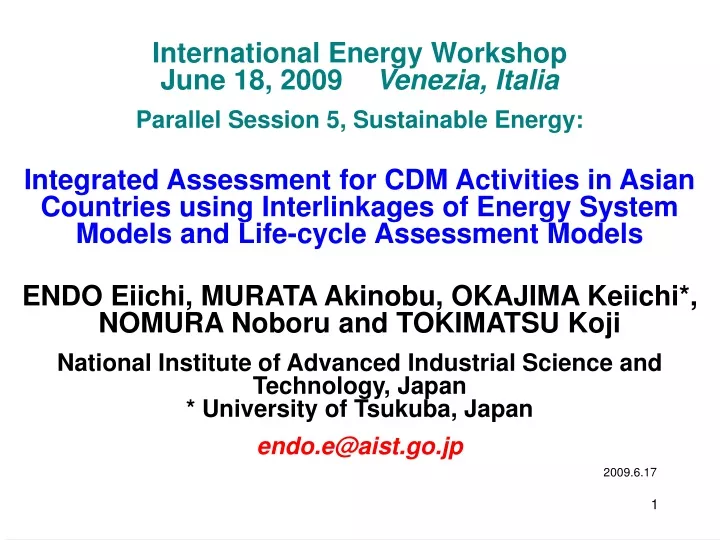
International Energy Workshop June 18, 2009 Venezia, Italia Parallel Session 5, Sustainable Energy: Integrated Assessment for CDM Activities in Asian Countriesusing Interlinkages of Energy System Models and Life-cycle Assessment Models ENDO Eiichi, MURATA Akinobu, OKAJIMA Keiichi*, NOMURA Noboru and TOKIMATSU Koji National Institute of Advanced Industrial Science and Technology, Japan* University of Tsukuba, Japan endo.e@aist.go.jp 2009.6.17
Background Long- and middle-term GHG targets in Japan Long-term: by 2050, 60~80% reduction from present Middle-term: in 2020, 15 (8)% reduction from the level in 2005 (1990) Large amount of GHG reduction needs energy demand reduction by changing life-style and/or social system and innovative energy technology development might be feasible, but it will cost too much Mechanisms under the Kyoto protocol Clean Development Mechanism (CDM), Joint Implementation and Emissions Trading will be continued in the next framework after 2012 technology transfer, financial support, cost-effective, GHG reduction, co-benefits, air pollutants reduction
Purpose To develop a method for evaluating CDM activities by supply-side energy technologies in Asian countries in the next decades from potential of CDM credits (certified emission reduction; CER) and cost-benefit including co-benefits points of view Method Integration of energy systems analysis and life-cycle assessment Energy system models: MARKAL for Japan and GOAL for Asia Life-cycle assessment models: Energy Chain Multi-layered Evaluation System and LIME: Life-cycle Impact Assessment Method based on Endpoint Modeling
Overview of the research Energy system models GOAL model for Asia Energy systems analysis Potential of CDM credits in Asian countries by region and technology Baseline grid emission factors MARKAL model for Japan Energy systems analysis Necessary CDM credits for Japan CDM activities by supply-side energy technologies Wind, PV, advanced thermal power generation, etc. CDM activities which have large potential of credits (CER) Energy Chain Multi-layered Evaluation System Life-cycle assessment Potential of CDM credits Life-cycle costs Life-cycle CO2, SOx and NOx emissions reduction LIME: Life-cycle Impact Assessment Method based on Endpoint Modeling Economic evaluation Period and regions Around 2020 Japan and Asian countries, such as China and India Cost-benefit analysis including co-benefits Life-cycle assessment models
Energy system model of Japan by MARKAL Outline from primary energy to final energy consumption, from 1988 to 2052, 13 periods, each period is 5 years Objective function: trade-off between total system cost and CO2 emissions Energy demand based on the Long-term Energy Supply and Demand Outlook” by the Japanese government (2008) Fossil fuel prices based on the World Energy Outlook 2007 (and 2008)
Modeled energy system of Japan by MARKAL. diesel LPG FCV gasoline HEV EV gasoline One of the results of the analysis. Market penetration of the next-generation vehicles in the passenger car sector in Japan under carbon tax 6 USD/t-CO2. EV, mini gasoline, mini
Results of the analysis 8% reduction from the level in 1990 Marginal abatement cost curve for energy-related CO2 emissions in 2020. Relationship between trade-off coefficient (carbon price) and energy-related CO2 emissions in Japan.
Discussions Necessary CDM credits for Japan The difference between the estimated energy-related CO2 emissions and the middle-term targetdoes not mean necessary CDM credit. The difference can be made up by the forest sink. The rests are made up by the mechanisms under the Kyoto Protocol, such as CDM, Joint Implementation and Emissions Trading, if the same framework will be continued after 2012. Energy-related CO2 emissions and marginal reduction cost curve The results of the analysis are not the same as the studies by others research institutes for discussing the middle-term target for Japan. The difference may be caused by the difference in modeling of energy conservation and technology options.
GOAL model for Asia Outline Time frame: from 1998 to 2055, 8 time periods, one time period is 5 to 10 years (flexible time slicing) Optimization: total system cost is minimized with constraints imposed on the CO2 emissions MARKAL like model linear programming, multi-region, covering Asian countries: Japan, China, Indonesia, Malaysia, the Philippines, Singapore and Thailand, to be extended to India China and Indonesia: divided into sub-regions Regions of the model.
The overall energy system: composed of mutually connected regional energy system Reference regional energy system. Energy demand: based on the IEEJ’s World/Asia energy outlook Task: to evaluate potential of CDM credits in Asian countries by region and technology Method for evaluating CDM activities: has been developed which can consider two conditions, additionality and profitability, same as actual CDM projects can reduce GHG from the baseline; are not cost-competitive, but become profitable by selling CERs
Results of the analysis (b) year 2020 (a) year 2015 CDM credit potential of renewable power generation in Southwest China by price of CER and crediting period. Wind : the lowest price of CER, 8 USD/t-CO2 with 21 year long crediting period, or 10 USD/t-CO2 during 14 years. VLSPV: the lowest price of CER, 130 USD/t-CO2 with 21 year long crediting period, CDM project is infeasible with 14 years.
Power generation planning model of the Chinese 6 major power grids For precise evaluation of potential of CDM credit, baseline grid emission factors in the future have to be estimated. Grid emission factors depend on the power generation technology mix, which depends on the load for the grid. A new power generation planning model of the Chinese 6 major power grids is developed. To build the model, annual load duration curves in the 6 major power grids in China in the next decades are estimated. Demand Time (year)
Energy Chain Multi-layered Evaluation System is one of the life-cycle assessment models developed so that it can assess a fully fuelled energy chain system from mining to utilization from life-cycle efficiency, CO2 emissions and cost points of view. Equipments are manufactured in Japan and transported to the sites in China. Multi-layers System boundary
Wind power generation in Xinjiang is assumed 1 GW equivalent Assumed installation sites of CDM activities in China.
Results of the LCA, Life-cycle CO2 emissions CO2 emission factor in Shanghai is smaller than that in the other regions due to smaller dependency on coal power plant. It can be reduced around half by introducing NGCC. In Xinjiang, wind power generation can reduce CO2 emissions drastically. Not only life-cycle CO2 emissions, but also life-cycle costs and SOx, NOx emissions are evaluated by the model.
LIME: Life-cycle Impact Assessment Method based on Endpoint Modeling Impact factors Weighting factors GOAL model for Asia: Baseline grid emission factors Energy Chain Multi-layered Evaluation System: CO2, SOx and NOx emissions reduction Impact categories Safeguard subjects LIME for Asia Human health Global warming Economic evaluation Social welfare Acidification Biodiversity Urban air pollution Primary productivity Σ Benefits and co-benefits Σ Additional costs Energy Chain Multi-layered Evaluation System: Additional investment, O&M and fuel costs Cost-benefit analysis Relationship among LIME for Asia, cost-benefit analysis and the other models. LIME is used for evaluating (co-)benefits by emissions reduction. The factors in the LIME have to be adjusted to Asia, because LIME is originally for Japan.
Adjusting weighting factors of LIME to Asia There are two approaches. Benefit transfer to estimate unknown weighting factors in developing countries by adjusting known weighting factors in developed countries using ratios of GDP per capita Based on the literature review, weighting factors are in proportion to the 0.5 power of ratio of GDP per capita Social survey to estimate weighting factors directly by questionnaires for willingness-to-pay to avoid human health risks 500 samples of social survey has been carried out in Shanghai and is planning in Delhi.
Results of the social survey weak WTP strong (Median RMB) weak WTP strong (Median RMB) Household income (1000 RMB) small Income large young Age old Dependency of willingness-to-pay to avoid human health risks on income and age in Shanghai. Large income makes WTP stronger than small income. On the other hand, elder people have weak WTP compared with younger people. This has been also confirmed in the social survey in Shanghai.
Results of the cost-benefit analysis Results of the cost-benefit analysis of an assumed CDM activity, replacement from conventional coal power plant to natural gas combined cycle power plant, in Shanghai. Co-benefits by reducing air pollutants, SOx and NOx, are larger than the benefit by CO2 emission reduction. Estimated cost-benefit is almost the same order compared with that in the other studies.
Summary An integrated method combining energy systems analysis and life-cycle assessment is proposed to evaluate CDM activities by supply-side energy technologies in the next decades in Asian countries from potential of CDM credits and cost-benefit including co-benefits points of view. Partial and tentative results of the analyses by the proposed method are introduced. Acknowledgement This research is supported by the “Global Environment Research Fund (B-074)” by the Ministry of the Environment, Japan.
Clean Development Mechanism (CDM) Kyoto Protocol Target Achievement Plan of Japan: GHG -6%: energy-related CO2 +0.8 to 1.8%, forest sink -3.9%, mechanisms under the Kyoto protocol -1.6%, etc. CDM projects by country (%) CDM projects by technology (%) Based on the CDM projects data analysis by IGES, Japan (May 1, 2009)
SOx emission intensity of supply-side energy technologies with desulfurization efficiency of 85% for IGCC, NGCC and USC in China. Contribution of each unit process in the energy chain to cumulative CO2 emission intensity in Shanghai.