Download
1 / 21
210 likes | 307 Vues
This study compares DT-MRI data with histology images to assess the accuracy of measuring nerve fiber density via automated processing. The research aims to extract and analyze relevant features from histology samples and compare them to MRI measurements.

E N D
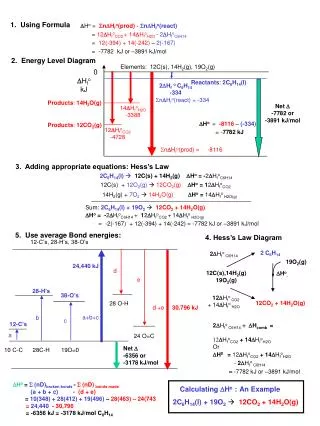
Estimating Nerve Axon Density by Automated Processing of High-Resolution Histology Images for Comparison with MR Measurements of Water Diffusion Anisotropy F. N. Golabchi1, W. S. Hoge2, H. Mamata2, S. Maier2, D. H. Brooks1 1 CDSP Center, Northeastern University 2 SPL, Brigham and Women’s Hospital and Harvard Medical School
Motivation: Verifying DT-MRI Results • Diffusion-Tensor MRI measures direction and magnitude of water diffusion in tissue • Fractional Anisotropy: • In tissue with fibers (e.g. nerve tissue), DTI is used to find and characterize fibers • How well do these measurements correspond to the anatomy?
KEY Question: • How well do DT-MRI measurements match physiology? • Our Goal: • Extract relevant features from histology data (by spatial domain processing) • Compare features to DT-MRI measurements • Resolution mismatch: • Histology features on the scale of a few pixels • 1 MR pixel corresponds to ~1M histology pixels
Histology Images of Spinal Cord Tissue Histology slice • Digital images of histology sample tissue Through-plane axon regions Gray-matter In-plane axon Histology tile image • Data Acquisition: The tissue is sliced, stained & multiple images taken w/microscope to create a mosaic
Line Scan Diffusion tensor Imaging (LSDI) • Recently developed DT-MRI technique • Free of bulk motion and imaging artifacts • Does not use cardiac gating or head restraints • Does not require special gradient hardware • Could be implemented on conventional scanners
Comparison • In each tile we compare: • DT-MRI data: Fractional Anisotropy (FA) • Histology data: Density of through-plane axons (axon count / axon area) • Register and “re-cut” the histology slice so they match the DT-MRI pixels (a) FA image of slice 03 (b) Histology image of slice 03
Registration Problem • Histology images shrunk/stretch in the staining process • Use anatomical MR (e.g. T1-weighted) images to register the histology images with DT-MR images • Register histology images with T1-weighted images • Register the new histology images with DT-MR images and re-cut them such that one MR pixel correspond to one histology tile (a) T1-weighted image (b) FA image (c) Histology image
Featured problems • 1- In-plane Axon Orientation: Fourier approach • Goal: Measures of dominant direction and degree of anisotropy • Our approach: Two rounds of Fourier Transform at two resolution levels • 2- Through-plane Axon Identification and Segmentation: Density Estimation • Identify through-plane axons • Calculate an axon density measure
Histology Image Preprocessing and Filtering Segmentation and Labeling Watersheds Intensity test Shape Requirements Through-plane Axons Problem 2: Through-plane Axon Segmentation & Density Estimation • Identify objects: • Dark, separated objects Morphological operation to enhance the contrast (image + top-hat - bottom-hat) • Boundaries around local minima Watershed Segmentation (watershed boundaries separate merged objects) • Appropriate intensity-level Gray-level Test (average-intensity) • Certain shape and size Shape-based removals (area, length, circularity)
Intermediate Results: Filtering and Labeling • Thresholding the filtered image • Segmenting the connected components as objects (with pink boundaries) • Problem 1: Merged objects • Problem 2: Objects with non-axon-like shapes
Intermediate Results: Watershed Segmentation and Shape Requirements • Separates merged objects before applying shape constraints Gray-scale image Filtered image • Problem 1: solved Merged objects separated Watershed Lines segment segment • Problem 3: Some low-intensity objects separated and remain in the image as axon candidates & *if* Shape constraints
Final Results: • Compare the average gray-scale value of the objects with a threshold before shape constraints RGBimage Gray-scale Filtered image • Problem 3: solved Low-intensity objects removed • Problem 2: solved Objects with non-axon-like shapes removed *if* Shape requirements & Segmentation Watersheds Intensitytest
Ex. 1: Through-plane axons in histology tile denoted with pink boundaries
Ex. 2: Through-plane axons in histology tile denoted with pink boundaries
Ex. 3: Through-plane axons in histology tile denoted with pink boundaries
Ex. 4: Through-plane axons in histology tile denoted with pink boundaries
Comparison Results: Axon Area vs. FA (a) FA images (b) Density Images (Density = total area occupied by through-plane axons)
Comparison Remarks 1: • Scatter plot: Scatter plots of fractional anisotropy (FA) of DT-MRI data vs. density measures of histology data (Density= total area occupied by through-plane axons) • Mismatches: mismatches in high FA values
Comparison Remarks 2: • Suggestion: Force manual boundaries to the histology slice for a fair comparison • Problem: Subjective
Conclusion • Using a combination of standard image processing tools (morphological operations, watershed segmentation, image analysis,…) we have developed an algorithm that successfully identifies through-plane axons • Visually, the Densityimages obtained with this algorithm, show strong correlation with FA images obtained from LSDI generated DT-MRI data in most regions, but also show some anomalies in some other regions • Work remains in registration and outlier resolution to numerically quantify the Correlation