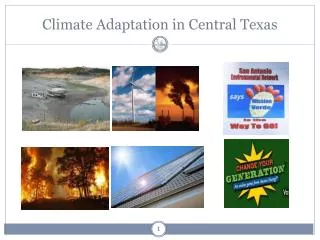
Climate Adaptation in Central Texas
Texas is a leader in greenhouse gas (GHG) emissions, primarily from energy generation. Despite a significant reduction of 8.3% in CO2 emissions from 2000 to 2010, Texas remains the highest emitter in the U.S., contributing 663 million metric tons in 2010. While nearly half of these emissions stem from petroleum fuels, Texas has made strides in renewable energy, particularly wind, which constituted 8% of its energy in 2010. This report explores the sources of GHG emissions and outlines strategies to advance climate adaptation in the region.

Climate Adaptation in Central Texas
E N D
Presentation Transcript
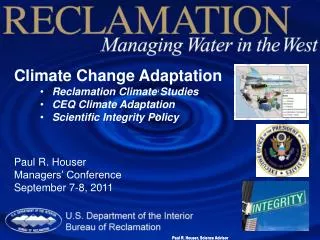
Texas Leads the Nation in GHG EmissionsWhere do Greenhouse gas emissions come from in Texas? Source: Greenhouse Gases: A Report to the Commission.Texas Natural Resource Conservation Commission 2002.
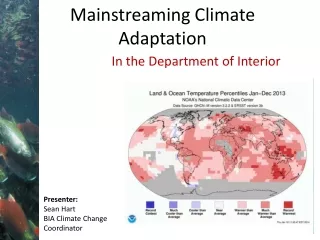
Texas Emits more Global Warming Gasses from Electric Generation than Other States Carbon dioxide emissions from energy rose in 18 states and fell in 32 between 2000 and 2010 with Texas showing the greatest absolute decline of 58.8 million metric tons, according to data released by the US Energy Information Administration. Despite the 8.3 percent drop in emissions, Texas still led the US states in CO2 emissions from energy with 663 million metric tons in 2010, followed by California and Pennsylvania. Nearly half of Texas’ emissions came from petroleum fuels in 2010, according to the EIA data.
Growth in Texas’ GHG Emissions Despite an 8.3 percent drop in GHG emissions from 2000 to 2010, Texas still led the US states in CO2 emissions from energy with 663 million metric tons in 2010. In 2010 8% of Texas’s energy came from wind. Source: Energy Information Administration.
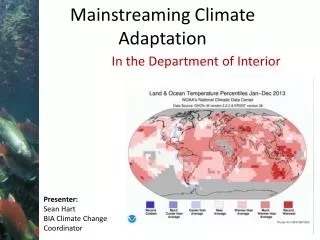
Cooler Power:Texas Leads the Nation in Renewable Energy Potential Everywhere you look, the potential for solar in Texas is good The maps on this page are from National Renewable Energy Laboratory’s report - U.S. Renewable Energy Technical Potentials: A GIS-Based Analysis Total estimated technical potential for concentrating solar power in the United States Total estimated technical potential for urban utility-scale photovoltaics in the United States Total estimated technical potential for rural utility-scale photovoltaics in the United States Total estimated technical potential for rooftop photovoltaics in the United States
Texas Has Been VERY Successful Promoting Wind Over 12,776 Mw of wind built Statewide total of all renewables at the end of 2012 was 13,107 Mw Exceeding the 2025 target of 10,000 Owner Date Online MW Power Purchaser/User Turbine Wind Power Partners ('94) FPL Energy 1994 FPL Energy 39.8 110 KVS-33 Delaware Mountain FPL Energy 1999 28.5 Lower Colorado River Authority Zond 750-kW (38) Big Spring IHoward County Caithness Existing Project or Area April 1999 27.72 TXU Electric & Gas Big Spring IIHoward County Caithness June 1999 6.6 TXU Electric & Gas / York Vestas 1.65-MW (4) Southwest Mesa Wind Farm FPL Energy May 1999 Lower Colorado River Authority 74.9 NEG Micon 700-kW (107) Hueco Mountain Wind Ranch,El Paso County El Paso Electric Mar 2001 1.32 El Paso Electric Vestas V-47 (2) King Mountain Wind Ranch Vestas V-47(42) American Electric Power Southern Public Service (Xcel Energy) 2001, 2003 Texas-New Mexico Power Co. / Reliant Energy / Austin Energy Woodward Mt. I & II, Pecos County FPL Energy Apr 2001 159.7 TXU Energy Vestas V-47 (242) Trent Mesa American Electric Power (AEP) 281.2 Aug 2001 TXU Energy Enron 1500 (100)Project Info Indian Mesa FPL Energy Dec 2001 82.5 TXU (31.5MW), LCRA (48.5MW) Vestas V-47(125) Desert Sky Wind Farm Bonus 1300 (214); Vestas 3-MW (1) American Electric Power (AEP) Dec 2001 160.5 Enron 1500 (107)Project Info Llano Estacado Wind Ranch at White Deer Shell Wind Energy Nov 2001 80.0 Southwestern Public Service (Xcel Energy) Mitsubishi 1000 (80) Brazos Wind Ranch Shell Wind Energy / Mitsui Indian Mesa 4th Q 2003 TXU Energy / Green Mountain Power Mitsubishi 1000 (160) Sweetwater Babcock & Brown & Catamount Energy 2003, 2005, 2007 505 TXU Energy, Austin Energy, CPS Energy GE Wind 1.5-MW (176); Mitsubishi 1-MW (135); Siemens 2.3-MW (46) City Public Service of San Antonio 160 Vestas 2003 DWS/John Deere Wind Energy Vestas 3-MW (1) Callahan Divide Wind Energy Center, Taylor County FPL Energy 2005 114 Austin Energy GE Wind 1500 (76) American Windmill Museum Suzlon 1.25-MW (8) American Wind Power Center .66 American Windmill Museum Vestas 660 kW (1) McKinney Wal-Mart Bergey Windpower 2005 0.05 McKinney Wal-Mart Bergey Windpower 50 kW (1) N.A. Buffalo Gap AES Corp. 2005 Direct Energy Vestas 1.8 MW (67) Horse Hollow Wind Energy Center FPL Energy 2005/2006 735.5 various GE Energy 1.5 MW (291); Siemens 2.3 MW (130) Red Canyon 2005 FPL Energy 84 various GE Energy 1.5 MW (56) JD Wind I DWS/John Deere Wind Energy 2006 10 Southwestern Public Service (Xcel Energy) 120.6 2006 150.0 JD Wind II 2006 Southwestern Public Service (Xcel Energy) Suzlon 1.25-MW (8) JD Wind III DWS/John Deere Wind Energy 2006 10 Southwestern Public Service (Xcel Energy) Suzlon 1.25-MW (8) 3 JD Wind V 2006 10 Southwestern Public Service (Xcel Energy) Suzlon 1.25-MW (8) Forest Creek Wind Farm Airtricity 2006 124.2 TXU Energy 10 Siemens 2.3-MW (54) JD Wind VI John Deere Wind Energy/community wind 10 Southwestern Public Service (Xcel Energy) Suzlon 1.25-MW (8) Lone Star I (2nd Q) Horizon Wind 2007 72 Direct Energy Gamesa 2 MW (36) DWS/John Deere Wind Energy Camp Springs 2007 130.5 N.A. GE Energy 1.5 (87) Wildorado Edison Mission Group 2007 160 2007 Invenergy Siemens 2.3 MW (70) Proposed Wind Projects in Texas
The Austin Climate Protection Plan will make Austin the leading city in thenation in the fight against global warming. The broad elements of the plan to reduce greenhouse gas (GHG) emissions include: 1. Municipal Plan. Makes all COA facilities, fleets and operations totally carbon-neutral by 2020. 2.Utility Plan. Utility Plan, reducing total energy use by 800 MW and increasing renewable portfolio to 35% of its power mix by 2020;requirements for carbon neutrality on any new generation; and by early retirement of existing utility GHG emissions. 3.Homes and Buildings Plan. Makes Austin building codes for both residential and commercial properties the most energy efficient in the Nation including all new home net zero ready by 2015 . 4.Community Plan. Develops a comprehensive plan for reducing GHG emissions from sources community-wide. 5. “Go Neutral” Plan. Provides mechanisms for all businesses and individuals to reduce their carbon footprint to zero.
Key areas for adaptation/ policy include: • Transportation: plug-in hybrids, lower emitting rapid transit, bikeable city • Land Use Planning • Emerging Technologies • Waste Management • Natural Areas and Landscapes • Multigenerational Education
Austin • It has a great value of solar rate at 12.8 cents a kWh (readjusted annually) • An optional time-of-use rate • A progressive 5 tiered rate block rate program • A solar committee reviewed solar goal and recommended expanding to 400 MW Pecan Street Project – Testing high concentrations of renewable energy, electric vehicles and other smart grid devices-Dr Michael Webber: “Most detailed database of home energy use-age in existence” • 1/3 homes have solar installed • Over 200 homes with detailed monitoring, including 20 homes with smart water & gas meters • Over 100 residents will have Chevy Volts by end of 2012 • Companies such as Sony, Best Buy, Whirlpool and Intel will install smart devices and appliances in 750-1,000 homes • Energy Labs: • Pike Powers Research Laboratory & Center for Commercialization offers specialized capabilities for developing, testing and validating consumer electronics and applications that incorporate metrology, building controls, solar PV, natural gas fuel cell, machine-to-machine, vehicle charging and disaggregation technologies. • Austin Energy Green building
Net Zero Energy Homes & Transportation San Antonio’s first net zero energy home opened in 2011. The 3,900-square-foot home’s average monthly utility bill is expected to total $50, according to Mike Scott, the builder. Sol – solutions oriented living – is a community of 40 modern homes three miles east of downtown Austin. The homes are net-zero energy capable, all-electric, and built to a 4 or 5 Star rating under the Austin Energy Green Building Program.
San Antonio Mission Verde and Vision 2020 • Reduce Water and kWh Usage • Increase energy building efficiency • Double the Number of Green Jobs as many as 8,800 • Train the young to install efficiency and Renewable Sources • Reduce Amount of Material Going Into Landfills • Triple Public Transportation Ridership • Decrease Travel Time • Triple Number of Miles of "Complete Streets” • Increase City's Tree Canopy • Reduce CO2 emission by over 1 million tons per year
San Antonio • In 2011, CPS Energy committed to gradually phase out and retire its aging JT Deely coal plant 15 years ahead of schedule., • 1500 MW renewable goal • over 400 MW of clean solar power will provide CPS Energy customers with Texas-based energy • CPS Energy’s Save for Tomorrow Energy Program (STEP) has so far saved 317 megawatts (MW) of electric load, goal set in 2010 to avoid 771 MW by 2020
Renewable Potential and Impact in Central Texas * There are 325,851 gallons in 1 acre foot. As a rule of thumb in U.S. water management, one acre-foot is taken to be the planned water usage of a suburban family household, annually. In the desert South West, where water conservation is followed and often enforced, a typical family uses only about 0.25 acre-feet of water per year. In Texas during drought times, the water savings above reflect the annual water usage of nearly 667 thousand households.
Why are Central Texas Cities and COOPs Taking Action? • Our cities own public electric utilities • Setting goals easier at public utilities, because customers can influence policy. • Public participation has pushed these cities and utilities to do more. • Cities see value in job creation • Energy efficiency upgrades jobs • Solar – 615 jobs in Solar in Austin alone • Renewable energy creates 3-4 times more jobs per unit of energy produced than fossil fuel generators
Next Phase: Shutting Down Old Coal Austin’s Fayette Coal Plant San Antonio’s Deely Plant Fayette: 11,459,125 tons of CO2 • JT Deely: 5,940,250 tons JT Deely: 5,940,250 tons of CO2
Why Central Texas? • The municipal governments own the utilities • History of populist progressive government • Facing crises in water, drought, energy • Blessed with lots of sunshine • Have lots of educational, research capabilities and high tech • Strong interregional cooperation
Crisis: • We have conclusive evidence that climate change is occurring and that human activity is contributing to that change • We are seeing the impacts of climate change throughout Texas and locally with more extreme weather impacts • Our water crisis is becoming acute Lots of responsive governments and agencies in the areaand opportunities • Next Steps- • get involved in moves to shut down old coal plants and boost efficiency and renewables • Rate case at CPS • Shut down Deely and increase efficiency • Austin Energy debate • Local Solar and Fayette closure debates • 2015 Austin City Council Elections No excuse for inaction, given what you know today Why you need to act now!
It’s far better to act and be a little wrong than to fail to act and have been catastrophically wrong! “The Time to act is now. Acknowledging the reality of a well documented problem is critical: taking swift and decisive action to solve it is the mark of leadership.” Dallas Morning News “From Talk to Action”