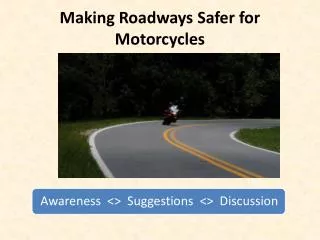
Saving Lives: A Road Safety Initiative for a Safer Future
This initiative aims to combat the national challenge of road accidents, which cause thousands of fatalities and injuries each year along with substantial economic losses. By implementing key strategies such as passing primary safety laws, expanding roadway visibility features, and increasing enforcement, we strive to reach our goal of reducing fatalities to 1,000 or fewer by 2008. The importance of public education, rumble strips, and guard cable barriers is emphasized for enhancing road safety. Join us in supporting this mission to save lives on the road.

Saving Lives: A Road Safety Initiative for a Safer Future
E N D
Presentation Transcript
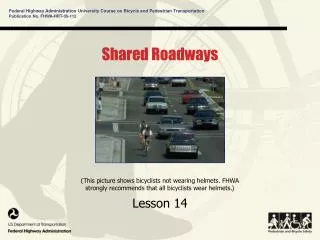
Safer Roadways The Challenge 57th Traffic Conference
The Crash
The Crash Problem
The National Problem — 2005 • 43,200 Fatalities • 2.68M Injuries • $230.6B / year • $820 per person 3.3 Million Deaths Since 1928
The National ProblemTomorrow • Of every 84 children born this year: • One will die in a highway crash. • 50 will be injured in a crash during their lifetimes…some more than once.
6 Year Fatality Trend • = 1,157 • = 1,098 • = 1,208 • = 1,231 • = 1,130 • = 1,257
Death Rate Per 100m Vehicle Miles National 1.46 Missouri 1.7
Safety Belt Use United States - 82% Missouri - 77%
What Are We Doing?
"Our" Statewide Reduction Goal 1,000 or Fewer Fatalities by 2008
Our RecordOur Goal YearFatalities 2000 1,157 2001 1,098 2002 1,208 2003 1,232 2004 1,130 2005 1,257 2008 1,000 or less
We Can Do It… 1983 1982 1984 AGAIN ! 1993 1992 1985
Fatal Crashes State Non - State 24% 76%
Critical Safety Partners YOU !!!
H O P E IS NOT A STRATEGY
8 “Essential” Pass a primary safety belt law and maintain and enhance existing safety laws.
All-Rider Helmet Law Maintained
Why Pass A Primary Law ? • 90 Lives Saved • 1,000 Serious Injuries Prevented • Medicaid Savings of $103M over 10-year Period • 16.2M Additional Dollars from SAFETEA-LU
Why Keep An All-Rider Helmet Law? • Passed in 1967 – Saved hundreds of lives • Unhelmeted motorcyclist – 40% more likely to incur fatal head injury • Motorcycle helmets are 67% effective in preventing brain injuries
Motorcycle Deaths In Five States Before and After Helmet Repeals
8 “Essential” Increase public education and information on traffic safety issues.
8 “Essential” Expand the installation of shoulder, edge-line and centerline rumble strips.
Rumble Strips • Freeway Shoulder Rumble Strips • ROR Crashes, Reduction 15-80% • Edge Line Rumble Strips – Two-lane • ROR Crashes, Reduction 20-25% • Centerline Rumble Strips • Head-on and Sideswipe Crashes 20-25%
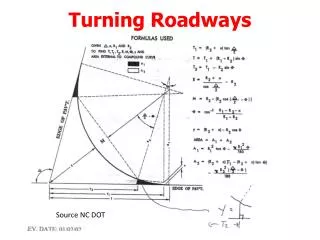
8 “Essential” Expand, improve and maintain roadway visibility features.
Pavement Markings • Wider Longitudinal Pavement Markings • Wider markings – up to 12 inches • A low cost safety improvement that: • Reduces crash frequency • Improves lane positioning • Benefits older drivers • Improves driver comfort • On-Pavement Horizontal Signing
8 “Essential” Expand installation of median 3-strand guard cable or equivalent barrier.
8 “Essential” Expand installation and maintenance of roadway shoulders and clear zones.
8 “Essential” Increase enforcement on targeted crash corridors.
8 “Essential” Effectively deter, identify, arrest and adjudicate alcohol and other drug impaired drivers and pedestrians.
Implement Plan STATE REGIONAL
Shared Responsibility
How Can You • Support “OUR” Goal and the Blueprint • Join A Regional Coalition • Support Key Safety Legislation • Drive Responsibly ME & YOU
May 15, 2006 356 Deaths 21% Decrease from 2005
Areas of Concern
Pick-Up Truck Safety Belt Use 66%
Teen Safety Belt Use 56.4%
Last 3 Years 500 Teenagers Killed 78% Not Wearing Safety Belt