Download
1 / 22
230 likes | 480 Vues
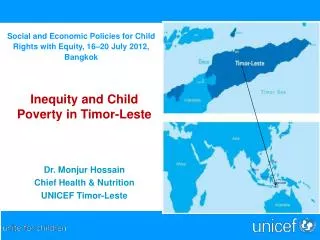
Social and Economic Policies for Child Rights with Equity, 16 –20 July 2012, Bangkok. Inequity and Child Poverty in Timor-Leste Dr. Monjur Hossain Chief Health & Nutrition UNICEF Timor-Leste. Timor-Leste. Portuguese Timor: 450 years (since mid of 16 th century)

E N D
Social and Economic Policies for Child Rights with Equity, 16–20 July 2012, Bangkok Inequity and Child Poverty in Timor-Leste Dr. MonjurHossain Chief Health & Nutrition UNICEF Timor-Leste
Timor-Leste • Portuguese Timor: 450 years (since mid of 16th century) • East Timor, Indonesia: 1975 – 1999 • UNTAET : 1999 – 2002 • Timor-Leste: Independent East Timor. Third free and fare election conducted on 7 July 2012 • UNMISET / UNMIT: Leaving in Dec 2012 Good Bye Conflict, Welcome Development
Timor-Leste Non-oil GDP Growth % US$ Non-oil GDP per capita Source: TLDPM Document,Ministry of Finance, 2012
Petroleum Revenue, Return and Withdrawals As at end Apr 2012 US$10.54 billion Source: TLDPM Document, Ministry of Finance, 2012
Government Spending – 4 times in 5 years 1,674 1,306 759 604 484 Source: A Citizen’s Guide to the 2012 State Budget Timor-Leste, MoF
GDP is going up but health expenditure is going down Source: (http://apps.who.int/nha/database/StandardReport.aspx?ID=REP_WEB_MINI_TEMPLATE_WEB_VERSION&COUNTRYKEY=84560)
Lowest in the Region Source: World Bank: World Development Indicators and Global Development Finance
Inequity: Lowest $ to the highest mortality district Government state budget for District Health Services Highest U5MR (102), Lowest Expenditure Source: Dept. of Finance & Planning 2010, MoH
Inequity: Declining Allocation for Programs & Services Source: World Bank Financial and Economic Analysis for NHSSP-SP Project, 2010
Inequity: HR distribution 1st level facilities in TL, 2010 Source: Timor Leste HMIS : 2,6 Midwives and 6,0 Rest Nurses/ 10 000 population
Child Poverty: How do children experience? Care & Protection
Child Poverty: Multi-dimension in TL, 2009-10 Source: TL-DHS 2009-10, NSD
Multidimensional Poverty: Coverage Deficit Score Timor-Leste: 49% Source: TL-DHS 2009-10, NSD
Child Deprivation Index by District, DHS 2009-10 • U5 Child NOT stunted • DPT-3 coverage • Skilled Birth Attendance • Access to Sanitation • Primary Net Enrolment • Birth Registration Source: TL-DHS 2009-10, NSD
Child Deprivation Index by Villages 6 indicators: - NER - Skilled attendant at delivery - Access to Water - Access to Sanitation - Household with concrete floor - Access to Radio Source: 2010 Census, NSD
Economic Growth and Child Poverty Source: (http://apps.who.int/nha/database/StandardReport.aspx?ID=REP_WEB_MINI_TEMPLATE_WEB_VERSION&COUNTRYKEY=84560)
Inequity and Child Poverty Source: TL-DHS 2009-10, NSD
Inequity: Economic & Social Development in MICs Source: SOWC 2010, UNICEF
Conclusion • Huge increase in Government investment but inverse trend in social sectors (increase vulnerability, loss of window of human capital development) • Widespread disparity and inequity: Inter-Districts, Inter-Programs, Income Groups • In-equity in distribution and management of resources: Declining allocation for service delivery, mal-distribution of human resources • Inequity due allocative inefficiency and execution inefficiency: Poor decentralized capacity in planning & budgeting • The multi-dimension of child poverty: Deteriorating despite economic improvement – poor household income and ability.
Recommendations • A comprehensive study and analysis of the public budget allocation and execution. • Policy brief on planning and budgeting to improve efficiencies in resource allocation and utilization. • Advocacy on child-friendly budgeting to remove deprivations of children and alleviation of poverty. • Support districts to enhance their capacity on evidence based planning, budgeting and execution.
All rights for each and every child