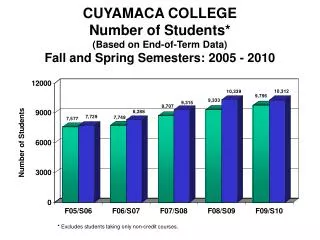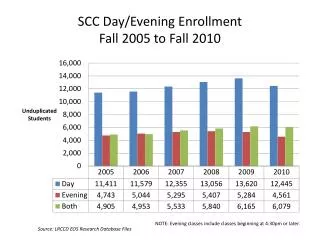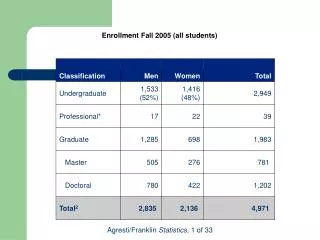
Enrollment Fall 2005 (all students)
790 likes | 960 Vues
Enrollment Fall 2005 (all students). Geographic Origin 3 (Fall 2005). Student Demographics (Fall 2005). Chapter 1 Statistics: The Art and Science of Learning from Data. Learn …. What Statistics Is Why Statistics Is Important. Chapter 1. Learn… How Data is Collected

Enrollment Fall 2005 (all students)
E N D
Presentation Transcript
Chapter 1Statistics: The Art and Science of Learning from Data • Learn …. What Statistics Is Why Statistics Is Important
Chapter 1 • Learn… How Data is Collected How Data is Used to Make Predictions
Section 1.1 How Can You Investigate using Data?
Health Study • Does a low-carbohydrate diet result in significant weight loss?
Market Analysis • Are people more likely to stop at a Starbucks if they’ve seen a recent TV advertisement for their coffee?
Heart Health • Does regular aspirin intake reduce deaths from heart attacks?
Cancer Research • Are smokers more likely than non-smokers to develop lung cancer?
To search for answers to these questions, we… • Design experiments • Conduct surveys • Gather data
Statistics is the art and science of: • Designing studies • Analyzing data • Translating data into knowledge and understanding of the world
Example from the National Opinion Center at the University of Chicago: • General Social Survey (GSS) provides data about the American public • Survey of about 2000 adult Americans
Three Main Aspects of Statistics • Design • Description • Inference
Design • How to conduct the experiment • How to select the people for the survey
Description • Summarize the raw data • Present the data in a useful format
Inference • Make decisions or predictions based on the data.
Example: Harvard Medical School study of Aspirin and Heart attacks • Study participants were divided into two groups • Group 1: assigned to take aspirin • Group 2: assigned to take a placebo
Example: Harvard Medical School study of Aspirin and Heart attacks • Results: the percentage of each group that had heart attacks during the study: • 0.9% for those taking aspirin • 1.7% for those taking placebo
Example: Harvard Medical School study of Aspirin and Heart attacks Example: Harvard Medical School study of Aspirin and Heart attacks • Can you conclude that it is beneficial for people to take aspiring regularly?
Section 1.2 We Learn About Populations Using Samples
Subjects • The entities that we measure in a study • Subjects could be individuals, schools, countries, days,…
Population and Sample • Population: All subjects of interest • Sample: Subset of the population for whom we have data
Example Format • Picture the Scenario • Question to Explore • Think it Through • Insight • Practice the concept
Example: The Sample and the Population for an Exit Poll • In California in 2003, a special election was held to consider whether Governor Gray Davis should be recalled from office. • An exit poll sampled 3160 of the 8 million people who voted.
Example: The Sample and the Population for an Exit Poll Example: The Sample and the Population for an Exit Poll • What’s the sample and the population for this exit poll? • The population was the 8 million people who voted in the election. • The sample was the 3160 voters who were interviewed in the exit poll.
Descriptive Statistics • Methods for summarizing data • Summaries usually consist of graphs and numerical summaries of the data
Inference • Methods of making decisions or predictions about a populations based on sample information.
Parameter and Statistic • A parameteris a numerical summary of the population • A statistic is a numerical summary of a sample taken from the population
Randomness • Simple Random Sampling: each subject in the population has the same chance of being included in that sample • Randomness is crucial to experimentation
Variability • Measurements vary from person to person • Measurements vary from sample to sample
Inferential Statistics are used: • To describe whether a sample has more females or males. • To reduce a data file to easily understood summaries. • To make predictions about populations using sample data. • To predict the sample data we will get when we know the population.
Chapter 2Exploring Data with Graphs and Numerical Summaries • Learn …. The Different Types of Data The Use of Graphs to Describe Data The Numerical Methods of Summarizing Data
Section 2.1 What are the Types of Data?
In Every Statistical Study: • Questions are posed • Characteristics are observed
Characteristics are Variables A Variable is any characteristic that is recorded for subjects in the study
Variation in Data • The terminology variablehighlights the fact that data values vary.
Example: Students in a Statistics Class • Variables: • Age • GPA • Major • Smoking Status • …
Data values are called observations • Each observation can be: • Quantitative • Categorical
Categorical Variable • Each observation belongs to one of a set of categories • Examples: • Gender (Male or Female) • Religious Affiliation (Catholic, Jewish, …) • Place of residence (Apt, Condo, …) • Belief in Life After Death (Yes or No)
Quantitative Variable • Observations take numerical values • Examples: • Age • Number of siblings • Annual Income • Number of years of education completed
Graphs and Numerical Summaries • Describe the main features of a variable • For Quantitative variables: key features are center and spread • For Categorical variables: key feature is the percentage in each of the categories
Quantitative Variables • Discrete Quantitative Variables and • Continuous Quantitative Variables
Discrete • A quantitative variable is discrete if its possible values form a set of separate numbers such as 0, 1, 2, 3, …
Examples of discrete variables • Number of pets in a household • Number of children in a family • Number of foreign languages spoken