
Calibration of CCD Sensitivity Variations by Wavelength
This project develops methodologies and algorithms to calibrate the relative quantum efficiency of each pixel in Charge-Coupled Devices (CCDs) by wavelength. Using multiple flat-field CCD exposures with narrow pass-band filters, the study creates correction frames to address pixel-to-pixel quantum efficiency variations. The software developed enables linear interpolation between wavelength frames, significantly reducing the noise level by about 40%. This calibration enhances spectroscopic analysis and ensures more accurate scientific research in astrophysics.

Calibration of CCD Sensitivity Variations by Wavelength
E N D
Presentation Transcript
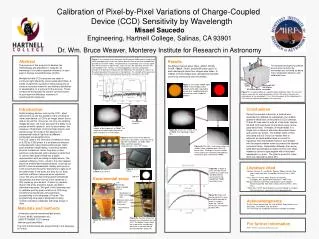
Calibration of Pixel-by-Pixel Variations of Charge-Coupled Device (CCD) Sensitivity by Wavelength Misael Saucedo Engineering, Hartnell College, Salinas, CA 93901 Dr. Wm. Bruce Weaver, Monterey Institute for Research in Astronomy Abstract The purpose of this project is to develop the methodology and algorithms to calibrate, by wavelength, the relative quantum efficiency of each pixel in Charge-Coupled Devices (CCDs). Multiple flat-field CCD exposures are taken in continuum light filtered by narrow pass-band filters. A series of algorithms operate on these exposures to create a correction frame for any arbitrary distribution of wavelengths on a science CCD exposure. These corrections will typically be used to correct for pixel-to-pixel quantum efficiency variations in spectrographic exposures. Figure 1. An example of the motivation for this project: MIRA spectra showing the weak absorption lines in the star Pleione due to a shell of gas that exploded from its surface in the late 1990’s. The spectrum is a combination of a cool star, alpha Per, with thousands of atomic lines, and a hot star, like zeta Peg, with very few non-hydrogen lines. Analysis of shell propagation, chemical composition, changes in temperature and gas density depend on the quantitative analysis of the weak absorption lines present in the spectrum. The strength of the weak lines is comparable to the uncorrected pixel-by-pixel Q.E.variations in the CCD. Results The software developed to calibrate pixel-to-pixel variations by wavelength was achieved by doing linear interpolation between each calibrated frame. Six different narrow-band filters, 4300Å, 4500Å, 5145Å, 5896Å, 7000Å, and 9000Å were used. For each wavelength about four images were taken. A median of these images was calculated to eliminate cosmic ray events and other anomalies. Figure 7. Left image: 5896Å; right: 7000Å. These images show smooth illumination required to assure that neighboring pixels receive the same number of photons. Figure 10. A representation of a spectroscopic calibration cube. The row and column represent the spatial dimensions of the CCD, and in the other axis corresponds to the wavelength. This is the final product of the calibration of a CCD with the software developed in this internship. Conclusions During this summer internship, a method was developed to calibrate, by wavelength, the relative quantum efficiencies of the pixels of CCD cameras. Fortran 90 was used to write all of the code. Various flat-field CCD exposures where taken using narrow pass-band filters. A median of these frames in a single color is taken to eliminate discordant values and cosmic ray events. The median frame is then smoothed with a 2-D box car median filter to establish an intermediate frame to correct for vignetting. The intermediate frame is then divided into the original median frame to produce the desired correction frame. Interpolation between the narrow-band filter wavelengths provides the fine color steps needed to correct a spectrogram with a thousand wavelengths or more. The pixel-to-pixel Q.E. noise level was reduced by about 40%. Introduction Digital imaging devices, such as the CCD , allow astronomers to see the wonders of the universe as never seen before; a CCD is an image sensor that is able to do just this. Of course, not only can amazing images be seen, but it can also grant the ability to do precise scientific research such as photometry--the measure of brightness of astronomical objects--and spectroscopy--the study of the dispersion of astronomical objects’ light into its different component wavelengths/colors. The CCD used in this internship contained an array of 2,532 by 3,352 pixels. It is an electronic detector composed with many photosensitive pixels. Each pixel operates independently, converting incident photons to electrons, which they store in their electronic potential well until a readout is performed to convert each pixel charge into a digital representation with an analog-to-digital device. The quantum efficiency (Q.E.), which is the ratio between electrons emitted and incident photons, is as high as 80-90% at some wavelengths. Ideally, each pixel in CCD would have the same responsivity to light as all the other pixels in the array, but they do not. Each pixel has a different response when exposures occur. Not only are their total quantum efficiencies idiosyncratic but their color-by-color variations in Q.E. varies by pixel as well. Cosmic ray impacts, dust on the array, and other issues can affect individual exposures. The goal of this internship was to calibrate pixel-by-pixel variations of CCD array sensitivity by wavelength using extensive programming in the language of Fortran. This programming language is designed for heavy number calculation especially with large arrays of data. Figure 3. Shows some of the different narrow pass band filters used. From left to right the wavelengths are 3400, 4300, 7000, and 5145 angstroms. 1 angstrom (Å) = 1.0 × 10⁻¹⁰ meters Figure 5. A CCD Camera sensor Figure 4. An SBIG ST-8300M CCD Camera Pixel-to-pixel variations Figure 2. To the left a flat frame of the median of four exposures at 7000Å. The image on the right shows the pixel-to-pixel variations of a small section. Results Figure 8a. Shows the median frame at 7000Å. The vignetting is about 10%. Figure 8b. The right- hand image shows the median frame smoothed with a 5x5 2-D boxcar filter. Dividing this into the median frame corrects the vignetting and produces the pixel-by pixel correction at 7000Å. Literature cited Clerman, Norman S., and Walter, Spector. Modern Fortran Style and Usage. New York: Cambridge University Press, 2012. Print. Hahn, Brian D. Fortran 90 for Scientist & Engineers. Burlington, Ma.: Butterworth-Heinemann, 1994. Print. Metacalf, Michael, John Reid, and Malcolm Cohen. Modern Fortran Explained. New York: Oxford University Press, 2011. Print. ¹ SBIG refers to The Santa Barbara Instrument Group, a company that manufactures astronomical telescope equipment. Figure 9a. A graph of pixel value by column number of a single CCD row before being corrected with the appropriate 7000Å correction frame. Top view Experimental setup usb connection SBIG ST-8300M Camera Wood plates to block unwanted light Figure 9b. Shows the pixel-by-pixel Q.E. noise level being reduced for pixels in a single exposure. The Q.E. noise level was reduced by about 40%. Acknowledgments Dr. Wm. Bruce Weaver and the staff of MIRA, Andy Newton, Ana Hernandez, Pat McNeill, and Joe Welch This internship was funded by the Hartnell College Foundation. Milk glass plate used to diffuse the illumination • Materials and methods • -Computer, external memories(flash drives) • -Fortran 90/95, sensitometer box • SBIG¹ ST-8300M CCD Camera • Narrow pass band filters Narrow-band filter Figure 6b. Top view shows the desired even illumination for the CCD. The bottom image shows the inside of the sensitometer box which is normally closed during calibration exposures. row (2532) Figure 6a. Experimental set up. For further information Please contact misaelsaucedo@hotmail.com. column (3352) Wavelength λ(Å) 1200 different wavelengths The main method used was programming in the language of Fortran. 8.5 million pixels


