Download

1 / 81
810 likes | 939 Vues
Presented by: Henry Acosta, MA, MSW, LSW Executive Director National Resource Center for Hispanic Mental Health. Culturally Competent Social Service Delivery to Latinos. Presented at: Marymount University School of Social Work - Lehigh Valley Program DeSales University Center

E N D
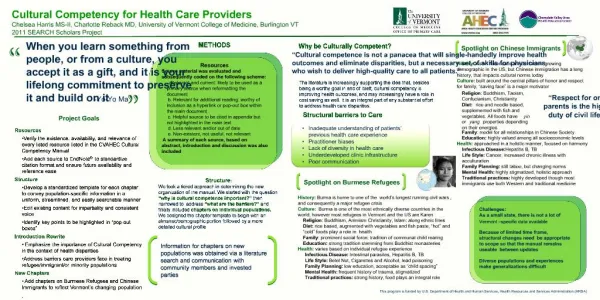
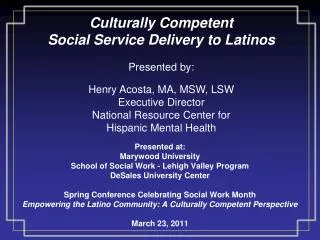
Presented by: Henry Acosta, MA, MSW, LSW Executive Director National Resource Center for Hispanic Mental Health Culturally Competent Social Service Delivery to Latinos Presented at: Marymount University School of Social Work - Lehigh Valley Program DeSales University Center Spring Conference Celebrating Social Work Month Empowering the Latino Community: A Culturally Competent Perspective March 23, 2011
Sen. Robert F. Kennedy, 1968 CULTURAL DIFFERENCES ARE NOT A NATIONAL BURDEN… THEY ARE A NATIONAL RESOURCE
Presentation Learning Objectives • To increase awareness among participants about the changing face of America as a result of exponential Latino population growth over the last several decades and the challenges that this has created for social service and human service organizations all across the nation. • To increase awareness among participants about existing disparities in the availability of, access to and the provision of culturally and linguistically competent social and human service delivery to Latinos and how these disparities are negatively affecting the population. • To assist participants in thinking about creative ways/best practices to attract, engage, retain and serve Latinos in social and human service programs.
What is Culture? Culture refers to integrated patterns of human behavior that include the language, thoughts, communications, actions, customs, beliefs, values, and institutions of racial, ethnic, religious, or social groups. Source: Based on Cross, T., Bazron, B., Dennis K., & Isaacs, M., (1989). Towards A Culturally Competent System of Care Volume I. Washington, D.C.: Georgetown University Child Development Center, CASSP Technical Assistance Center).
Relevance of Culture to the Delivery of Social Services • Persons of different cultures such as varied ages, religions, racial and ethnic groups, sexual orientation, gender identity, disability, including persons who are deaf and hearingimpaired, and those for whom English is not their primary language, have unique characteristics that have been found to cause them to be partially or poorly served or excluded from existing health and mental health treatment, trainings, and rehabilitation programs, and to receive an array of social services that do not reflect their cultural needs and preferences.
Relevance of Culture to the Delivery of Social Services(continued) • Ex. - Culture defines how: - health care information is received; • how rights and protections are exercised; • what is considered to be a health problem; • how symptoms and concerns about the problem are expressed; • who should provide treatment for the problem; and • what type of treatment should be given.
Cultural Sensitivity, Cultural Diversity, and Cultural Competence
CULTURAL SENSITIVITY AND CULTURAL DIVERSITY • CULTURAL SENSTIVITY:How staff explore theirown backgrounds and attitudes towards consumers • CULTURAL DIVERSITY:How an organization deals with differences among staff and matches staff to consumers
CULTURAL COMPETENCE CULTURAL COMPETENCE: System-level, organizational issues in dealing with a multicultural consumer population • Includes cultural sensitivity and cultural diversity • Goes beyond attitudes and staffing patterns • Includes skills and program elements which enhance services to a diverse consumer population
CULTURAL COMPETENCE CONTINUUM • CULTURAL DESTRUCTIVENESS • Views persons of color as inferior • Discrimination open and purposeful • CULTURAL INCAPACITY • Adopts the cultural inferiority premise • Discrimination present, but more subtle • Unfairness in hiring • Condescension towards minority consumers
CULTURAL COMPETENCE CONTINUUM • CULTURAL BLINDNESS • Focus on delivering the same services to allconsumers • Agency philosophy professes to be unbiased • Model of service is designed with the dominant cultural group in mind • CULTURAL PRE‑COMPETENCE • Focuses on symbolic efforts in hiring and programs • Core of the agency remains the same
CULTURAL COMPETENCE CONTINUUM • BASIC CULTURAL COMPETENCE • Respect for cultural differences • Program adaptations that take culture into account • Continuing self‑assessment on culture‑related issues • ADVANCED CULTURAL COMPETENCE • Places culture in “high esteem” • Agency practice supported by: • Research on cultural competence • Proficiency among staff in developing culturally competent treatment approaches • Dissemination of demonstration project findings • Promotion of improved ties with wider community Terry Cross. 1988. Focal Point
Recap and Importance of Cultural Competence • Cultural competence is a goal toward which all professionals, agencies and systems must strive. Becoming culturally competent is a developmental process that incorporates—at all levels—the importance of culture, an assessment of cross-cultural relations, vigilance about the dynamics that result from cultural differences, the expansion of cultural knowledge and the adaptation of services to meet cultural needs. It is also a developmental process that can improve the quality of health, mental health and social service care and human service delivery system for all Americans.
Importance (continued) • Social service providers must be aware of and have an understanding of the wide-ranging role culture plays in shaping what people bring to the social service setting and how it shapes treatment professionals. They must also consider cultural factors and influences when working with people of all ethnicities and cultures, as these areas account for variations in the way consumers communicate their symptoms, which ones they choose to report, whether they seek treatment or not, what type of help they may seek, and what types of social support and coping styles are available. • Cultural influences have also been found to shape treatment professionals, who share a set of beliefs, norms and values with their colleagues. As a result, health care professionals in particular can view symptoms, diagnoses and treatments in ways that diverge from the views of the consumers they treat. Considering, and more importantly, demonstrating commitment to understanding and respecting cultural factors and influences are key components of providing culturally competent social services.
Listing of Major Professional Reports Related to Disparities in Access to and the Provision of Quality Health and Mental Health Care for Racial and Ethnic Minorities • U.S. Surgeon General’s first ever report on mental health, Mental Health: A Report of the Surgeon General, 1999 http://www.surgeongeneral.gov/library/mentalhealth/home.html • U.S Surgeon General supplemental report, Mental Health: Culture, Race Ethnicity, 2001 http://www.mentalhealth.samhsa.gov/cre/default.asp • Institute of Medicine Report, Unequal Treatment: Confronting Racial and Ethnic Disparities in Health Care, 2002 http://www.iom.edu/report.asp?id=4475 • President’s New Freedom Commission on Mental Health, Achieving the Promise: Transforming Mental Health Care in America, 2003 http://www.mentalhealthcommission.gov/reports/FinalReport/toc.html
Overview of Findings from Referenced Reports • Mental illness does not discriminate! • Mental health is fundamental to overall physical health and must be viewed as an integral part of physical health. • According to the World Health Organization, one in four people in the world will be affected by mental health or brain disorders during their lives, but few will seek or receive help. • Individuals from racial and ethnic minority groups tend to underutilize mental health services. • Multiple studies show that in comparison to the majority population, minorities have less access to and availability of care, and tend to receive poorer quality mental health services (Mental Health: Culture, Race, and Ethnicity, A Supplement to Mental Health: A Report of the Surgeon General).
Overview of Findings from Referenced Reports • Effective treatments are available for most disorders, but Americans do not share equally in the best that science has to offer (Mental Health: A Report of the Surgeon General, 1999). • Disparities in mental health services exist for racial and ethnic minorities, and thus, mental illness exacts a greater toll on their overall health and productivity (Mental Health: A Report of the Surgeon General, 1999). • Studies show that poor mental health and psychological distress are linked to poverty – In 2009, the overall poverty rate in the U.S., was 14.3%. The rates were much higher among most racial and ethnic minority groups (25.8% for African Americans, 25.3% for Hispanics). Hispanics highest % increase from ’08 to ’09.* • According to Mental Health: Culture, Race, and Ethnicity, A Supplement to Mental Health: A Report of the Surgeon General, those in the lowest strata of income, education and occupation are two to three times as likely to have a mental disorder as the highest strata and often lack health insurance.
Additional Findings Related to Poverty, Education and Income • In 2008, about 29 percent of U.S. adults (25 years of age or older) had at least a bachelor's degree, including 52 percent of Asian/Pacific Islander adults, 33 percent of White adults, 20 percent of Black adults, 13 percent of Hispanic adults, and 15 percent of American Indian/Alaska Native adults. * • In 2008, the unemployment rate was higher for Hispanics (8 percent), Blacks (9 percent), American Indians/Alaska Natives (10 percent), and persons of two or more races (10 percent), than it was for Whites and Asians (4 percent each). In general, lower unemployment rates were associated with higher levels of education for each racial/ethnic group. * • Between 1997 and 2007, the percentage of 16- to 24-year-olds who were high school status dropouts1 decreased from 11 percent to 9 percent. In 2007, the status dropout rate was higher among Hispanics (21 percent) than among Blacks (8 percent), Asians/Pacific Islanders (6 percent), and Whites (5 percent). *
Additional Findings Related to Poverty, Education and Income • Black and Hispanic youth are more likely than non-Hispanic whites to drop out of high school. In 2005, 6 percent of non-Hispanic whites ages 16 to 24 were not enrolled in school and had not completed high school, compared with 11% of blacks and 23% of Hispanics; 41.3%). • In 2007, the median income of male workers was generally higher than that of female workers for each race/ethnicity and at each educational level. Median income differed by race/ethnicity. For example, of those with at least a bachelor's degree, the median income was $71,000 for White males and $69,000 for Asian males, compared with $55,000 for Black males and $54,000 for Hispanic males. For females, of those with at least a bachelor's degree, the median income was $54,000 for Asians, compared with $50,000 for Whites, $45,000 for Blacks, and $43,000 for Hispanics. * * = Source: US Department of Education, Institute for Education Services, National Center for Education Statistics - NCES – 2010-015, July 2010
Overview of Findings from Referenced Reports • Stigma and shame deter many Americans, including racial and ethnic minorities from seeking treatment (Mental Health: A Report of the Surgeon General, 1999). • Barriers to minorities seeking treatment include cost of care, societal stigma, and the fragmented organization of services (Mental Health: Culture, Race, and Ethnicity, A Supplement to Mental Health: A Report of the Surgeon General). • Mental health workers must consider cultural factors and influence when working with people of all ethnicities and cultures. • According to the U.S. Surgeon General’s report, Mental Health: Culture, Race and Ethnicity, a supplement to the Surgeon General’s 1999 report on mental health, “Cultural differences must be accounted for to ensure that minorities, like all Americans, receive mental health care tailored to their needs”.
Surgeon General’s Report on Mental Health: Culture, Race & Ethnicity • Culture counts! - culture & society play pivotal roles in mental health, mental illness and mental health services • Striking disparities in mental health care for racial and ethnic minorities • Minorities have less access to and availability of mental health resources • Minorities less likely to receive needed mental health services • Minorities in treatment receive poorer quality care • Minorities are underrepresented in mental health research • Disparities impose a greater disability burden on minorities Source: USDHHS (2001). Mental Health :Culture, Race and Ethnicity – A Supplement to Mental Health: A Report of the Surgeon General
Overview of Findings from Referenced Reports and Other Studies • African Americans and Hispanics more likely to be involuntarily admitted to psychiatric hospital • African Americans and Hispanics more likely to be prescribed older medications • African Americans and Hispanics more likely to be restrained during inpatient care • Individuals from minority groups less likely to follow up with community mental health care upon hospital discharge • African Americans and Hispanics more likely to be diagnosed with a severe mental illness • African Americans more likely to be diagnosed with schizophrenia • Hispanics more likely to be diagnosed with bipolar or anxiety disorders
Overview of Findings from Other Reports • Too often, when symptoms reach the point of crisis, which many will and is common among racial and ethnic minorities, the most expensive services are required through emergency rooms and inpatient treatment. In many cases, jails and detention centers have become the front-line “providers”of mental health services, causing a much greater financial burden than if prevention and community-based resources were readily available and affordable to everyone. • Reports also show that the burden of mental illness goes beyond the fragmented service system and into the business sector. It is in the interest of corporations to provide adequate mental health coverage as part of their employee benefits. Research shows that untreated depression costs firms $31 billion a year in lost productivity. • On a more positive side, more is known today about the causes of mental illness than ever before, and through groundbreaking research, treatments that work are available. According to recent reports, about 70 to 90 percent of mental illness are treatable. In fact, some findings report that 80 percent of patients with depression can recover now, and 74 percent of patients with schizophrenia can live without relapses if early intervention is made. Recovery is possible, and everyone regardless of their age, sex, religion, race, ethnicity or national origin should have the same rights to meaningful access and receive these critical services.
Facts Specifically Pertaining to Hispanic Mental Health • United States 2000 Census data shows people of Hispanic backgrounds are the fastest growing ethnic group in our country. In fact, Hispanics now represent the largest ethnic minority group in the nation, and the U.S. Census Bureau estimates that Hispanics will number around 132 million by the year 2050. The Census Bureau also estimates that racial and ethnic minorities will constitute 47 percent of the nation’s population by the year 2050. • Income levels vary along racial/ethnic lines: 21% of all children in the United States live in poverty, about 46% of African Americans children and 40% of Latino children live in poverty • According to the Youth Risk Behavior Survey of 2005, 11.3% of Hispanic-Latino high school students (9th thru 12th grade) actually attempted suicide, the highest % of any group. Rates were higher for both Hispanic–Latino male and females as well. * = Center for the Future of Children, The Future of Children. Vol. 7, No 2, 1997.
Facts (Continued) • Hispanic-Latino youth have the highest rate of suicidal attempts reaching 10.7% compared to 6.3% for white youth and 7.3% for African American youth – this trend clearly demonstrates the need to increase access to mental health services, especially crisis intervention services for Hispanic-Latino youth (Vega & Algeria, 2001). • While Hispanic-Latino youth are less likely to receive mental health services, they are more likely to become involved with the juvenile justice and/or child welfare systems (Vega & Alegria, 2001). • Even when receiving services, Hispanic-Latino youth “in care” still receive fewer therapeutic services and remain “in care” for longer periods than other groups (Vega & Alegria, 2001). • A study conducted in 2001 with high school students indicated that 25% of Hispanic-Latino students meet the criteria for clinical depression, and the rate was even higher among Hispanic-Latina teenage females, reaching 31%, the highest rate of any group (Flores & Zambrana, 2001). Figures such as these have been repeatedly appearing in professional literature as of late, and unfortunately will continue if action is not taken immediately to address the complex issues on hand.
Facts (Continued) • According to the Youth Risk Behavior Survey of 1997, Hispanic-Latino students were significantly more likely to have consumed alcohol in their lifetime, to report current alcohol use, and to report episodic heavy drinking than African Americans (Caetano & Galvan, 2001). • A survey from the Commonwealth Fund revealed that Hispanic-Latino adults had the highest rate of depressive symptoms of any group with 53% of Hispanic-Latina females and 36% of Hispanic-Latino males reporting moderate to severe depressive symptoms a week prior to survey interviews (Collins, Hall & Neuhaus, 1999). • Hispanic-Latino deaths linked to cirrhosis and other` chronic liver disease ranked as the eighth leading cause of death in the late 1990’s for Hispanics-Latinos, but did not appear as one of the ten leading causes of death for either African Americans or whites (Caetano & Galvan, 2001).
Facts (Continued) • Between 1991 and 1998, Hispanic-Latino emergency room admissions for drug use increased by 80% (United States Department of Health and Human Services, 2000). • The use of heroin within the Hispanic-Latino community is particularly serious. In 1997, Hispanics-Latinos accounted for 32% of treatment admissions for heroin and 32% of all Hispanic-Latino drug use related deaths resulted from heroin use (Caetano & Galvan, 2001). These figures do not even include the tens of thousands of deaths among Hispanic-Latino men and women from the sharing of HIV contaminated syringes. • A lack of qualified bilingual and bicultural health and mental health care professionals exist throughout the United States. Many Hispanics-Latinos have Limited English Proficiency and possess the legal right to have the same access rights to quality services as other groups who do not have language barriers with health care and mental health care professionals. This right is given to them under Title VI of the United States Civil Rights Act of 1964 and must be protected and enforced.
Facts (Continued) • Studies show that patient satisfaction is higher when the patient and doctor are of the same race or ethnicity and that minority physician tend to care for minority patients in greater numbers and to work in medically underserved areas (United States Department of Health and Human Services, 2000). • Although Hispanics-Latinos now account for over 15% of the total U.S. population, they comprised less than 3% of physicians[1], 1% of clinical psychologists [2], 4.3% of social workers[3], and 1.7% of registered nurses [4] • [1] Physician Specialty Data: A Chart Book, Center for Workforce Studies, 2009. http://www.aamc.org/workforce/statedatabook/statedata2009.pdf • [2] Closing the Gap for Latino Patients, American Psychological Association, 2005. www.apa.org/monitor/jan05/closingthegap.html - [3] Licensed Social Workers in the U.S.,Center for Health Workforce Studies & NASW, Center for Workforce Studies, 2006. http://workforce.socialworkers.org/studies/chapter2_0806.pdf - [4] The Registered Nurse Population: Findings from the 2004 National Sample Survey of Registered Nurses, 2004.U.S. Department of Health and Human Services Health and Resources Administration. http://bhpr.hrsa.gov/healthworkforce/rnsurvey04/
Brief Reference of Federal Laws, Standards, and Initiatives Aimed at Eliminating Disparities in Access to and the Provision of Quality Health and Mental Health Services Healthy People 2010 For more information, please visit http://www.healthypeople.gov Title VI of the Civil Rights Act of 1964 For more information, please visit http://www.usdoj.gov/crt/cor/coord/titlevi.htm Revised National Standards for Culturally and Linguistically Appropriate Services (CLAS) in Health Care – U.S. Office of Minority Health For more information, please visit http://www.omhrc.gov/clas/finalcultural1a.htm National Network for the Elimination of Disparities in Behavioral Health, United States Substance Abuse and Mental Health Services Administration http://www.samhsa.gov
Changes in Focus of State Regulatory Bodies and Accrediting Organizations • State Regulatory and Licensing Bodies (ex., New Jersey Department of Human Services, State of New Jersey Department of Law and Public Safety, Division of Consumer Affairs, Board of Social Work Examiners) • Accreditation Bodies • JCAHO – Joint Commission on Accreditation of Healthcare Organizations • For more information, please visit http://www.jcaho.org • CARF – Commission on Accreditation of Rehabilitation Facilities • For more information, please visit http://www.carf.org
Culturally Specific Civil Rights, Health and Mental Health Advocacy Agencies, Trade Associations, Organizations • National Council of La Raza • League of United Latino American Citizens • National Latino Behavioral Health Association • National Asian American Pacific Islander Mental Health Association • National Leadership Council for African American Behavioral Health • First Nations Behavioral Health Association • National Alliance of Multi-Ethnic Behavioral Health Associations • National Association of Puerto Rican/Hispanic Social Workers • National Latino Behavioral Health Coalition • American Society of Hispanic Psychiatry
Listing of Recent Known Reports Focusing on Policy Recommendations and/or Changes in Various Systems Related to Hispanic Mental Health • The Status of and Proposed Future Direction of Mental Health and Substance Abuse for Hispanics in New Jersey – Mental Health Work Group, Health Subcommittee, Governor James E. McGreevey’s Hispanic Advisory Council on Policy Development Initiatives, November 2002 – Copy of Report Available Through Henry Acosta, (609) 838-5488, ext. 205 or hacosta@njmhi.org • Mental Health Issues and Platform Committee Policy Report - National Hispanic-Latino and Migrant American Agenda Summit – http://www.hispanicagendasummit.org/home.htm • National Congress for Hispanic Mental Health Action Plan – http://www.mentalhealth.samhsa.gov/cmhs/SpecialPopulations/HispMHCongress2000/
Primary Areas in NHLAAS Report • Community Education and Outreach Awareness Activities • Access to Care • Workforce Development • Culturally Competent Research and Evidence-Based Practices
Overview of PA Population by Race and Ethnicity (2000) People QuickFactsPennsylvaniaUSA White persons, percent, 2000 (a) 86.3% 75.1% Black or African American persons, percent, 2000 (a) 10.5% 12.3% American Indian and Alaska Native persons, percent, 2000 (a) 0.4% 0.9% Asian persons, percent, 2000 (a) 2.4% 3.6% Native Hawaiian and Other Pacific Islander, percent, 2000 (a) .01% 0.1% Persons reporting some other race, percent, 2000 (a) 1.9% 5.5% Persons reporting two or more races, percent, 2000 1.2% 2.4% White persons, not of Hispanic/Latino origin, percent, 2000 84.1% 69.1% Persons of Hispanic or Latino origin, percent, 2000 (b) 3.2% 12.5% • : Includes persons reporting only one race. • : Hispanics may be of any race, so also are included in applicable race categories. Z : Value greater than zero but less than half unit of measure shown Source U.S. Census Bureau: State and County QuickFacts. Data derived from Population Estimates, 2000 Census of Population and Housing, 1990 Census of Population and Housing, Small Area Income and Poverty Estimates, County Business Patterns, 1997 Economic Census, Minority- and Women-Owned Business, Building Permits, Consolidated Federal Funds Report, 1997 Census of Governments
Pennsylvania Population 1990 and 2000 • 1990 Total Population = 11,881,643 • 1990 Total Latino Population = 232,262 • Percentage of Latinos in 1990 = 1.96% • 2000 Total Population = 12,281,054 • 2000 Total Latino Population = 394,088 • Percentage of Latinos in 2000 = 3.21% • Total increase in population 1990 to 2000 • 399,411 – a 3.36% increase • Total increase in Latinos 1990 to 2000 • 161,826 – a 69.67 % increase; which represents 40.52% of the total increase in PA Source: US Census Data, 1990 and 2000
Pennsylvania Hispanic Population by Origin(Four Largest Hispanic Origin Groups Only) Increase/Decrease • Puerto Ricans: 228,557 +65.19% • Mexicans 55,178 +43.90% • Cubans 10,363 +72.22% • Other 99,990 +51.57% Total Hispanic/Latino Population in Pennsylvania, 1990: 232,262 Total Hispanic/Latino Population in Pennsylvania, 2000: 394,088 +69.67% Source: U.S. Census, 2000.
Overview of PA Population by Race and Ethnicity (2000 and 2009) People QuickFactsPennsylvania(2000) Pennsylvania (2009 - Estimated) White persons, percent, 2000 (a) 86.3% 85.2% Black or African American persons, percent, 2000 (a) 10.5% 10.9% American Indian and Alaska Native persons, percent, 2000 (a) 0.4% 0.2% Asian persons, percent, 2000 (a) 2.4% 2.5% Native Hawaiian and Other Pacific Islander, percent, 2000 (a) .01% Z% Persons reporting some other race, percent, 2000 (a) 1.9% Not Provided Persons reporting two or more races, percent, 2000 1.2% 1.1% White persons, not of Hispanic/Latino origin, percent, 2000 84.1% 80.9% Persons of Hispanic or Latino origin, percent, 2000 (b) 3.2% 5.1% • : Includes persons reporting only one race. • : Hispanics may be of any race, so also are included in applicable race categories. Z : Value greater than zero but less than half unit of measure shown Source: 2000 Data – see previous slide; 2009 data – Census Bureau: State and County QuickFacts. Data derived from Population Estimates, 2009 Census of Population and Housing,
Profile of Select Social Characteristics Geographic Area: Pennsylvania - 1990 Source, U.S. Census Bureau, Census 1990
Profile of Select Social Characteristics Geographic Area: Pennsylvania - 2000 Source, U.S. Census Bureau, Census 2000
Profile of Select Social Characteristics Geographic Area: Pennsylvania – 1990 and 2000 • Total PA Population (5 yrs of age and over - 2000): • 11,555,538 (470,368 ; 4.2% over 1990) • Language Spoken at Home: • English Only - 2000: 10,583,054 (304,760 ; 2.96%) • Language other then English: 972,484 (165,608 ; 20.52%) • Spanish: 143,658 ; 86.74% • Indo-European: 49,625 ; -29.97% • Asian & Pacific Islands: 59,170 ; 35.73% • Speak English less than very well: 368,257 (75,251 ; 25.68%) • Spanish: 52,353 increase (59.70% from 1990; 69.57% of total) • Indo-European: 12,038 decrease (-8% from 1990) • Asian & Pacific Islands: 31,174 increase (69.27% from 1990) • Source: US Census Data, 1990 and 2000
Profile of Select Social Characteristics Geographic Area: Pennsylvania –Comparison 1990 and 2000(continued) • Percentage of Spanish Speakers Reporting • Speaking English less than Very Well: • 2000: 39.38% • 1990: 41.37% • What are factors behind the % decrease? • Effectiveness of ESL programs, • Larger # of Native Born (78%) vs. Foreign Born (22%) in PA • Birth Rates – Native-Born (63%); Foreign-Born (37%) • Source: US Census, Demographic Profile of Hispanics in PA, 2008; Previous Citations
Additional Resource for State Profile Info • Demographic Profile of Hispanics in Pennsylvania, 2008 • http://pewhispanic.org/states/?stateid=PA • Major Highlights: • 589,000 Hispanics – nearly 50% increase from 2000 • Median Age: • All Hispanics: 25 • Native-Born: 20 • Foreign-Born: 35 • Non-Hispanic Whites (NHW): 42 • Non-Hispanics Blacks (NHB): 32 • Median Income: $22,405.17; 36.36% lower than whites • 69% of 5yrs & older speak language other than Eng. at home • 23% uninsured - compared to 8% of NHW and 16% NHB • 17 and younger, 12% - compared to 6% NHW & 8% NHB
Pennsylvania Latino Population –Highest Latino Populated Counties
Pennsylvania Latino Population -Highest Latino Populated Cities
Lehigh County Specific Date Total County Population: 1990 2000 2008 291,130 312,090 339,989 (16.78% increase from 1990 to 2008) Hispanic Population: 1990 2000 2008 15,001 31,881 54,514 (263.40% ; Ranks 136 out of more than 3100 counties in US) Hispanics as Percent of County Population: 5% 10% 16% Hispanic Pop. Change: Change from 1990 Change from 2000 16,880 22,633 Percent Change in Population: 113% 71%
So, is there a Need for Cultural Competence?
The Compelling Need for Cultural Competence • Demographic changes in the U.S. • Long-standing disparities in the mental health status of people of diverse backgrounds • Improve the quality of services • Meet legislative, regulatory and accreditation policies and guidelines • Gain a competitive edge in the marketplace Source: National Center for Cultural Competence Policy Brief 1, Winter 1999
Cultural Competence is Best Practice Culturally Competent Practices: • Improve access to mental health for underserved populations • Keep mental health services consumer centered and consumer driven • Focus service design to meet the needs of cultural groups, neighborhoods and communities • Enhance and improve service quality Source: NYS Office of Mental Health Fact Sheet on Cultural Competence in Mental Health Services
Latino Mental Health Issues: An OverviewSummary of Literature ReviewConducted for Changing Minds, Advancing Mental Health for Hispanics Prepared by: Peter J. Guarnaccia, Ph.D. & Igda E. Martinez, Psy.D. Rutgers University Presented by: Henry Acosta, MA, MSW, LSW Executive Director, National Resource Center for Hispanic Mental Health