Download
1 / 43
580 likes | 1.12k Vues
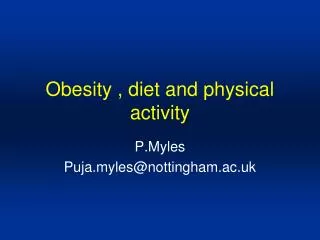
OBESITY, DIABETES, AND PHYSICAL ACTIVITY. Disease risk (relative to normal weight and waist circumference). Men ≤ 40 in. Men > 40 in. (102 cm) (102 cm) Women ≤ 35 in. Women > 35 in. Classification BMI (kg/m 2 ) Obesity class (88 cm) (88 cm). Underweight <18.5 — —

E N D
Disease risk (relative to normal weight and waist circumference) Men ≤40 in. Men > 40 in. (102 cm) (102 cm) Women ≤35 in. Women >35 in.Classification BMI (kg/m2) Obesity class (88 cm) (88 cm) Underweight <18.5 — — Normalb 18.5-24.9 — — Overweight 25.0-29.9 Increased High Obesity 30.0-34.9 I High Very high 35.0-39.9 II Very high Very high Extreme ≥40 III Extremely high Extremely high Note. BMI = body mass index. aDisease risk for type 2 diabetes, hypertension, and cardiovascular disease. bIncreased waist circumference also can be a marker for increased risk even in persons of normal weight. Classification of Overweight and Obesity by BMI, Waist Circumference, and Associated Disease Riska
Obesity and Overweight in the U.S. w Prevalence of obesity has dramatically increased in the past 35 years. w Nearly 67% of men and 62% of women are overweight or obese. w Prevalence in children has increased markedly since 1980. w Average adult gains 0.45 kg (1 lb) per year after age 25. w Average adult loses 0.2 kg (0.5 lb) of muscle and bone mass each year after age 25.
1971-1975 1976-1980 1988-1994 -24 230 33 -11 218 -11 -34 238 79
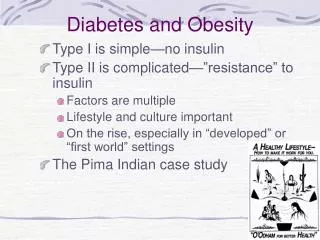
PREVALENCE OF OVERWEIGHT AND OBESITY IN WOMEN IN U.S. BY RACE
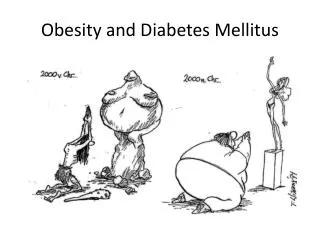
Potential Causes of Obesity w Genetic predisposition w Physiological, psychological, or emotional trauma w Hormonal imbalances w Cultural or familial factors w Diet composition w Physical inactivity
Resting metabolic rate (RMR) w Rate measured early in the morning after an overnight fast and 8 hours of sleep. w 60% to 75% of daily energy used Thermic effect of a meal (TEM) w Energy used for digestion, transport, and metabolism of ingested food w 10% of daily energy used Thermic effect of activity (TEA) w Energy above RMR needed to perform activities – most variable of the factors w 15% to 30% of daily energy used Energy Expenditure
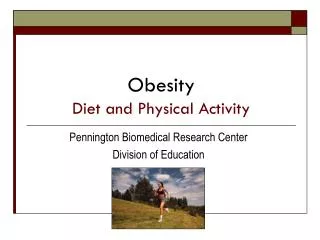
American Dietary Habits Since 1970, more Americans are eating more meals outside the home (i.e., high fat, high carb, high salt), relying more heavily on convenience foods, and consuming larger food portions (i.e., supersizing). These trends point to a general increase in daily energy intake over the past 30 years.
w It is hypothesized that the set point can increase with an increase in fat content ingested and a decrease in physical activity. Body Weight Control w A gain of 0.7 kg (1.5 lb) per year represents an imbalance of less than 15 kcal per day (the equivalent of one potato chip). w Body weight appears to be regulated around a set point.
Body Weight Control w Daily energy expenditure is made up of the resting metabolic rate (RMR), the thermic effect of a meal (TEM), and the thermic effect of activity (TEA). w The body defends its weight against changes in energy intake by increasing or decreasing these components. Thus, during dieting or fasting, the body decreases its RMR.
WEIGHT GAINS BETWEEN TWINS Identical twins were overfed by 1000 kcal/day for 84 out of 100 days – data show the strong genetic component in weight gain
BMI FOR PIMA INDIANS These data demonstrate the strong influence of the quantity and quality of the diet in persons with similar genetic background
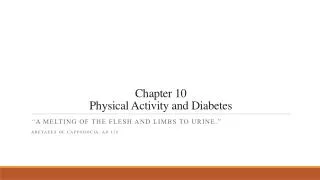
Health Risks of Overweight and Obesity w Increased overall mortality rates w Changes in normal body function such as respiratory function w Increased disease risks of CAD, hypertension, stroke, high blood lipids, and diabetes w Detrimental effects on existing heart, vascular, and metabolic diseases w Adverse psychological reactions
Methods of Estimating Obesity w Body composition measures (e.g., underwater weighing) w Relative weight w Body mass index w Waist-to-hip ratio
Upper-body (android) obesity w Greater fat storage in the upper body and abdominal area (apple shaped) w Occurs more frequently in men w Carries greater risk for CAD, hypertension, stroke, and diabetes Lower-body (gynoid) obesity w Greater fat storage in the lower body around the hips, buttocks, and thighs (pear shaped) w Occurs more frequently in women Fat Distribution
COMPUTED TOMOGRAPHY (CT) SCANS a b Method for measuring abdominal fat – these measures were made at the level of the fourth lumbar vertebra in two different people; the second (b) has much higher abdominal fat
Treating Obesity w Individuals respond differently to different treatments. w Weight loss should not exceed 0.45 to 0.9 kg (1 to 2 lb) per week and should be considered a long-term project. w Diets should stay balanced and meet the body's vitamin and mineral requirements. w The most effective treatments involve a permanent change in eating habits and behaviors and in physical activity levels.
Effects of Training on Body Composition w Increases calories used for energy wMetabolic rate remains elevated during recovery period w Increases lipid mobilization, losses of fat mass, and gains in fat-free mass – the greater the fat-free mass, the higher the RMR w Controls appetite such that intake better balances expenditure w Stress control?
Weight Loss Strategy Attempts to lose weight are most successful and long-standing if you lose no more than 0.45 to 0.9 kg (1 to 2 lb) per week and combine dietary restriction (300 to 500 kcal per day) with moderate aerobic and resistance exercise.
Energy-Balance Equation No body weight is gained or lost (excluding temporary changes in water) when the two sides of the energy-balance equation are equal; if the left side of the equation is greater, weight is gained; if the right side is greater, weight is lost: Energy intake − energy excreted = RMR + TEM + TEA
BODY CHANGES, DIET, AND EXERCISE Adult women maintained a total caloric deficit of 500 kcal/day for 16 weeks
Myths Exercise, even when localized (e.g., ab crunches), draws from fat stores throughout the body; thus, there is no such thing as spot reduction. Low-intensity aerobics burn no more fat than more vigorous exercise, and more total calories are spent with higher-intensity exercise when a given amount of time can be devoted to exercise.
Estimation of Kilocalories Used From Fat and Carbohydrate for a Low- and High-Intensity Aerobic Training Bout in a Fit, But Not Highly Trained 23-Year-Old Woman (VO2max = 3.0 L/min) . Average kcal for kcal for kcal forExercise VO2 Average %kcal %kcal 30 min 30 min 30 minintensity (L/min) RER CHO fat CHO fat total . Low, 50% 1.50 0.85 50 50 110 110 220 High, 75% 2.25 0.90 67 33 222 110 332 Note. RER = respiratory exchange ratio; CHO = carbohydrae.
What Role Does Exercise Play in Weight Loss? w Exercise alone does not lead to major changes in mass or body composition. From three major reviews, exercising for 6 months should decrease body mass by 3.5 lb, fat mass by 5.7 lbs, and relative fat by 3% (e.g., 30% to 27%) and increase fat-free mass by 2.2 lbs. w These changes are similar to those seen with diet, drugs, and behavior modification—disappointing! w Exercise likely plays its major role in preventing future weight gain, so the earlier we start the better. Also, in combination with diet, it facilitates loss of fat mass without loss in fat-free mass.