Materials and Processes
This guide covers the essentials of calculating the mean and standard deviation for samples and populations using statistical process control (SPC). Key concepts include definitions of terms such as mean, standard deviation, normal distribution, and the difference between samples and populations. It explores the importance of these calculations in quality control by observing manufacturing processes, capturing data accurately, and employing tools like Microsoft Excel for analysis. Enhance your proficiency in SPC while ensuring product quality through effective measurement techniques.

Materials and Processes
E N D
Presentation Transcript
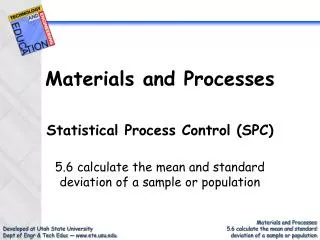
Materials and Processes Statistical Process Control (SPC) 5.6 calculate the mean and standard deviation of a sample or population
Performance Objective Given a data set of a sample or population calculate the mean and standard deviation using an electronic spread sheet.
Enabling Objectives • match the following terms with the appropriate definition: statistical process control (SPC), mean, standard deviation (sigma), population, sample, normal distribution (bell curve), tolerance, upper and lower limits • calculate a mean • calculate a standard deviation
Quality Control • Classical Quality Control is achieved by observing (measuring & testing) important properties of the finished product to determine acceptance or rejection. • Statistical Process Control uses statistical tools to observe the performance of the production line to predict significant deviations that may result in rejected products.
Normal Distribution • At the heart of statistical process control is the concept of a normal distribution or bell-shaped curve. • The frequency distribution of many events in nature and in processes used in manufacturing are found in practice to be approximated closely by the normal curve, and they are said to be normally distributed.
Bell-shape Curve The frequency curve, which is bell-shaped, is called the normal curve or normal distribution.
Statistical ProcessControl (SPC) • Statistical Process Control is a method for achieving quality control in manufacturing processes using statistical tools to detect if production is within limits. • Two of the more common tools used are mean and standard deviation which also describe the shape of the normal distribution.
Sample & Population • Often the size of a group makes it impractical to perform SPC calculations of the population. When this occurs, a sample is used. • The population is the entire group. • A sample is a sub-group of the population with the expectation that it is representative of the larger group.
Mean Mean is the average of a set of scores or values and is represented by the symbol, . The mean is calculated by adding the set of values then dividing by the number of values. Example:
Mean height of female high school students in the USA • It would be very impractical to measure the height of all female high school students in the USA in order to calculate their mean height. • It would be more practical to use a sample and only measure the height of the female students in your high school.
Standard Deviation Standard Deviation is an estimate of the average each item’s value differs from the group’s mean. Standard deviation is represented by the symbol, .
Standard Deviationof a Population • The formula for calculating the standard deviation of a population is: • Although this formula may appear complicated, it is relatively easy to solve.
Example—population data:5, 2, 8, 6, 4 Step 1: List the values of the data in the first column of the table labeled x. Step 2: Calculate the mean of the data in the first column.
Example—population data:5, 2, 8, 6, 4 Step 3: Complete column two by subtracting the mean from each item value, .
Example—population data:5, 2, 8, 6, 4 Step 4: Now square the value in column two and enter it in column three. Step 5: Sum the values in column three and divide by n. 20/5 = 4
Example—population data:5, 2, 8, 6, 4 Step 6: To obtain the standard deviation of the data, finish by calculating the square root of the value obtained in step 5.
Standard Deviationof a Sample • The formula for calculating the standard deviation of a sample is: • The only difference between the two standard deviation formulas is the denominator (n vs. n – 1).
Test Your Understanding Without performing calculations on paper, what is the mean of the following population of data: 20, 40, 50, 60, 80? A. 5 B. 20 C. 50 D. 60 Hint: Mean is the average
Test Your Understanding Without performing calculations on paper, what is the standard deviation of the following population of data: 20, 40, 50, 60, 80? A. 5 B. 20 C. 50 D. 60 Hint: Standard deviation is the estimated average each item deviates from the mean
Electronic Spreadsheet • Microsoft Excel is an excellent tool to calculate both the mean and standard deviation of a population or sample. • The command AVERAGE would be used to calculate the mean. • The command STDEVP would be used to calculate the standard deviation of a population. • The command STDEV would be used to calculate the standard deviation of a sample.
Excel Spreadsheet The graphic to the right shows the use of a spreadsheet to calculate the mean and standard deviation of a sample.