Database Design - Normalization Techniques
Learn how normalization organizes data, eliminates redundancy, and optimizes database structure. Follow step-by-step examples and exercises to master normalization principles.


Database Design - Normalization Techniques
E N D
Presentation Transcript
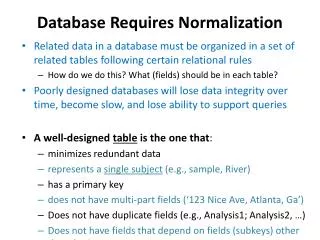
Database Design - Normalization • Normalization are a set of techniques for organizing data into tables in order to... • Eliminate most redundancy • Prevent incompleteness • Much of this presentation is devoted to a rather long example... will work through it together
Two Steps to Normalization • 1. Put the data into tabular form (by removing repeating groups) • 2. Remove duplicated data into separate tables
First - A Simple Example • Graphic 2-1 - Employee Qualifications
Put Data Into Tabular Form • Problem: What do we do if an employee has more than one qualification? • Graphic 2-2
1. Divide Data Into Two Tables • Employee Table • Emp#, Name, Dept#, DeptName, DeptLocation • Qualification Table • Emp#, Qualification Desc, Qualification Year • Graphic 2-3
2. Remove Duplicated Data • Notice that Dept. Number "05" is "Auditing" and is located at "HO" • It is repeated for every employee in that department • This wastes space • Makes updating data more complicated • "Elegance" rule is violated
Whose Data is it Anyway? • The basic problem is that department name and location are really data about departments rather than employees • It belongs in a separate Department table • Graphic 2-4
A Very Basic Example • This example was presented informally • The rules of normalization have their foundation in mathematics • On one hand, we can have confidence in normalization as a technique • On the other hand, it's very easy to become lost in mathematical terminology and proofs • Remember that data modeling is "design" and we should be careful about anything that lead us to one "right" answer.
Relational Notation • The sample tables we've seen so far take up a lot of space • We need a more concise notation • If we eliminate the sample rows, we are left with the table names and columns • Graphic 2-5
Relational Notation - cont. • Text books usually use data displayed as in Graphic 2-5 • Designers usually want a little more information • Graphic 2-6
Exercise • Normalize the database shown in the graphic • Take about 10 minutes • Remember two steps... • Put the information in tabular format • Eliminate redundant information • Graphic 2-E1
A More Complex Example • We'll introduce the rules of normalization as we proceed • The rules can be daunting at first, but we'll look at the problems they solve
Hospital Survey Example • The form displayed in Graphic 2-7 is one used in an actual survey of antibiotic drug usage in Australian hospitals • Survey used to determine which drugs and dosages were being used for various operations, to ensure that patients were properly prescribed for, and that the public was not paying for unnecessary drugs
One Form for Each Operation • Each hospital in the survey was given a unique hospital number • All hospital numbers were prefixed with 'H' • Hospitals fell into three categories: • 'P' for public • 'V for private • 'T' for training • All training hospitals were public so,'T' implied 'P'
Operations • All Operation Numbers were assigned sequentially be each hospital • Operation Code was a standard international code for the named operation • Procedure Group was a broader classification
Surgeons • Surgeon Number was allocated by individual hospitals to allow surgeons to remain anonymous • The prefix 'S' stood for surgeon
Drugs • The Total Drug Cost was the total cost of all drug doses for the operation • The bottom of the form recorded the individual antibiotic drugs used in the operation • The Drug Code consisted of the short name for the drug and the size of the dose
As the Study Continued... • ... It was decided to replace the heaps of forms with a computerized database • Graphic 2-8 shows the initial database design using the relational notation • This was done by one person, who was the data modular, the physical database designer, and the programmer
Exercise • Normalize the database as shown in Graphic 2-8 • Take about 15 minutes • Remember two steps... • Put the information in tabular format • Eliminate redundant information
Determining Columns • Normalization relies on certain assumptions about the way data is represented • We need to make sure that these are valid • There are some problems normalization does not solve • It is better to address these at the outset, rather than carry excess baggage through the whole normalization process • The following steps are necessary...
One Fact per Column • First we make sure that each column in the table represents one fact only • The Drug code column holds both a short name for the drug and a dosage size • The Dosage size consists of a numeric size and a unit of measure • The Hospital Category really provides two facts • Hospital Public or Private? • Does the hospital provide training?
Hidden Data • Make sure that we have not lost any data in the translation to tabular form • Common problem: We cannot rely on the rows of the table being stored in any particular order • Suppose the original survey forms had been filed in order of return • We would need a Return Date or Sequence column
Derivable Data • We need to remove any data that can be derived from other data in the table and amend the columns accordingly • Remember our basic objective is non-redundancy • The Total drug cost was derived by adding together the Drug Costs multiplied by the Number of Doses
Determining the Key • Key - a minimal set of columns that hold a different combination of values for each row in the table • The value of the Key uniquely identifies one row on the table • The combination of Hospital Number and Operation number • In relational notation, underline the key column(s)
Exercise • Using Graphic 2-8, Clean up the design (i.e. list all the columns that are valid in the new design) • Remember... • One fact per column • Don't lose hidden data • Remove data that can be derived • Determine the Key • Take about 10 minutes
After Tidying Up... • Graphic 2-9
Repeating Groups & 1st Normal Form • Our first task was to put the data in tabular format… • it might seem like we've done this • but we've actually hidden a problem about the drug administered data
Limiting Number of Occurrences • The drug administration data is the major cause of the tables complexity and inelegance • Drug Short Name 2, Drug Short Name 4 etc. • The columns needed to accommodate up to four drugs account for most of the complexity
Why Only Four Drugs? • Why not five or six or more? • Four drugs represented the maximum arrived at by asking one of the survey teams "What would be the maximum number of drugs used in an operation?" • In fact, this number was frequently exceeded • some operations had 10 or more
What's the Problem? • Part of the problem is that the question was poorly put… a line on the form was required for each drug-dose combination, rather than just for each different drug • The maximum number of drugs could increase later, so this model still rates poorly against the stability criterion
Paper Over the Differences • With the paper form, a continuation sheet was simply attached when more drugs were needed • We could add more columns to the table easily, but the application program changes would be much more difficult
What Was Done... • The original designer decided to handle continuations by suffixing the operation number with "a", "b", or "c" to indicate a continuation • This caused program changes and comprised the original simplicity of the system
Data Reusability & Program Complexity • The main difficulties are with data reusability and program complexity • Program can easily answer questions… • How many operations were performed by neurosurgeons? • Which hospital is spending the most money on drugs? • But not … • How much money was spent on Ampicillin?
Another Way • You might argue that some queries are always going to be more difficult than others • What would happen if we had designed the table on the basis of "one row per drug"?
Recognizing Repeating Groups • A Set of columns repeated a number of times - a "repeating group" - results in… • inflexibility • complexity • poor data reusability • Graphic 2-10 • curly brackets indicate a repeating group with an indefinite number of occurrences
Solution • A general and flexible solution should not set any limit on the maximum number of occurrences • It should also handle of few or no occurrences (the drug-free operation)
Removing Repeating Groups • First step of Normalization: • Put the data in tabular form by identifying and eliminating repeating group • Split the file into two tables • basic operation data • (repeating) drug administration table
Split into Two Tables • Remove all repeating group columns to a new table (each occurrence of group is a row in the new table • Include the primary key of the original table in the new table (this makes a foreign key in the new table)
Split into Two Tables - cont. • Add a 'Sequence' column if needed • Name the new table • Identify and underline the primary key of the new table
Exercise • Using Graphic 2-10 remove all repeating groups
Solution • Graphic 2-11
Determining Key of New Table • Not always an easy task • Question: What is the minimum number of combination of columns needed to uniquely identify one row?
A Six Column Key • Hospital Number - FK • Operation Number - FK • Drug Short Name • Dose • Unit of Measure • Method of Administration
First Normal Form • Our tables are now technically in first normal form (1NF). What have we achieved? • All data of the same kind in now held in the same place • The number of different drug dosages that can be recorded for an operation is effectively unlimited • An operation that don't use any drugs is allowed
Problems with First Normal Form • Look at Operation table in Graphic 2-11 • Every row for an operation (e.g. Hospital number 17) will contain the facts that its name is St. Vincent's and Fred Fleming is the contact person • Criterion of non-redundancy is not being met
More Problems • Change a fact about a hospital and you will have to change it for every operation in the hospital • If we delete the last operation for the hospital, then we effectively delete the hospital
Eliminating Redundancy • Solve all these problems by removing the hospital information to a separate table, in which each hospital number appears once only (which becomes the primary key) • Graphic 2-12
Determinants • For a given hospital number there could be only one... • hospital name • hospital type • contact person • training status • The hospital number is a determinant for the other columns
Formal Procedure • 1. Identify and determinants (other than the primary key) and the columns they determine • 2. Create a separate table for each determinant and its columns (the determinant becomes the primary key) • 3. Name the new table • 4. Remove the determined columns from the original table, leave the determinant
Other Determinants • Hospital number + Surgeon Number => Surgeon Specialty • Operation code => Operation Name, Procedure Group • Drug Short Name => Drug Name, Manufacturer • Drug Short Name + Method of Administration + Size of Dose + Unit of Measure = Cost of Dose