Significant Figures and Error in Scientific Measurements
Learn about significant figures and how they impact precision in scientific measurements. Explore different types of errors including systematic and random errors, with case studies on instrumental, methodological, and personal errors. Understand the importance of minimizing errors for accurate results.

Significant Figures and Error in Scientific Measurements
E N D
Presentation Transcript
Chapter 3 Experimental Error
- Significant figures - Precision (Reproducibility) - Accuracy (Error) - Uncertainty
3-1 Significant Figures • Significant figures: minimum number of digits required to express a value in scientific notation without loss of • accuracy (with the appropriate accuracy). Guidelines for Sig. Figs., when looking at a number 1) All nonzero digits are significant figures • 142.7 = 1.427 x 10² • 0.000006302 = 6.302 x10⁻⁶ 4 significant figures (sf) Zeros are simple place holders (3 sf) 9.25 x 10⁴ 9.250 x 10⁴ 9.2500 x 10⁴ (4 sf) 92500 (5 sf) • 2) Zeros are counted as significant figures only if: • i) occur between other digits in the number • 106 0.0106 0.106 • ii) occur at the end of a number on the right-hand side of the • decimal point • 0.1060 (3 sf) (4 sf)
The number of significant figures is the minimum number of digits needed to write a given value in scientific notation without loss of precision. 92, 500 9.25× 10⁴ 3significant figures 9.250 × 10⁴ 4significant figures 9.2500 × 10⁴ 5significant figures Zeros are significant 1) in the middle of a number, 2) at the end of a number on the right-hand side of a decimal point.
3-2 Significant Figures in Arithmetic How many digits to retain in the answer after you have performed arithmetic operations with your data? Addition and Subtraction:the same decimal place in the final answer 1.362 × 10 -4 + 3.111 × 10 -4 4.473 × 10 -4 5.345 + 6.728 12.073 7.26 × 10 14 -6.69 × 10 14 0.57 × 10 14 18.9984032 (F) + 18.9984032 (F) + 83.789 (Kr) 121.794 8064 1.632 × 10⁵ +4.107 × 10³ +0.984 × 10⁶ 1.632 × 10⁵ +0.04107 × 10⁵ +9.84 × 10⁵ 11.51 × 10⁵
- Multiplication and Division In multiplication and division, we are normally limited to the number of digits contained in the number with the fewest significant figures. 4.3179 × 1012 × 3.6 × 10-19 1.6 × 10⁻⁶ 34.60 ÷2.46287 14.05 3.26 × 10 -5 ×1.78 5.80 × 10⁻⁵ - Logarithms and antilogarithms IF n = 10a, then we say that a is the base 10 logarithm of n :
A logarithm is composed of a characteristic and a mantissa. The characteristic is the integer part and the mantissa is the decimal part log 339=2.530 log 3.39×10-5= -4.470 CharacteristicMantissa Characteristic Mantissa = 2 =0.530 =-4 =0.470 10 2.531 =340(339.6) 10 2.530 =339(338.8) 10 2.529 =338(338.1) antilog (-3.42) = 10-3.42 = 3.8 × 10 -4 log0.001237= -2.9076 antilog4.37=2.3 × 10 4 Log1 237= 3.0924 10 4.37=2.3 × 10 4 Log3.2=0.51 10-2.600=2.51 × 10 -3
3-3 Types of Error Experimental error from uncertainties of measurements - SYSTEMATIC ERROR: Systematic error , also called determinate error arises from a flaw in equipment or the design of experiment. - RANDOM ERROR: called indeterminate error arises from uncontrolled (and maybe uncontrollable) (GROSS ERRORS) ⇒mainly originated by person ⇒statistical calibration
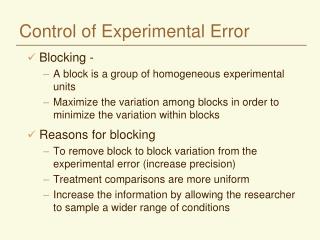
Systematic errors: determinate error ⇒ definite value, assignable cause. ⇒ bias-> 모든 결과에 같은 크기의 영향을 미치며, 부호를 가짐. Box 3-1. Case study : systematic error in Ozone Measurement
Sources of systematic errors Three types of systematic errors 1) instrumental errors 2) method errors 3) personal errors
■ Instrumental errors ⇒ measuring device error Ex) ① Pipet, burette, mass flask, etc. Reasons : The calibration temp.is nonequal to the measuring temp. Dry or heating cause the distortion of glass Contamination inside surface of vassel ②Electronic instrument error Reasons: potential change by dry cell life time Wrong calibration electric devise error by temperature change Noise from AC power source ③ Instrument operation in error conditions 이유: pH meter in strong acid solutions -> acid error ⇒ vibration → detectable, correctable
■ Method errors ⇒ From nonideal behaviors of reactions and reagents. ⇒Slow reaction, incomplete reaction, using unstable chemical, nonselectiveity of reagents, side reactions, etc.. ⇒The most difficult to remove it. Ex) using excess reagents - Due to chemical properties of nicotinic acid – degradation using hot and conc. H2SO4 - pyridine ring bearing nicotinic acid -> incomplete degradation. - Addition of potassium sulfateand elevate the boilng temp. -> complete degradation.
■ Personal errors ⇒ personal decision needs in many measurements. ⇒error, toward one direction 예) • Reading in position of pointer between two points. • Color at the end point • liquid level of burret • Color sensitivity ⇒personal bias 예) • 정밀도를 증가시키는 방향으로 눈금을 읽을 때 • 측정의 참값을 미리 마음 속으로 정해 놓을 때 • 숫자에 대한 편견이 있을 때 - 눈금 위의 바늘의 위치를 읽을 때 숫자 0과 5를 선호, - 큰 수보다 작은 수, - 홀수보다 짝수 선호
The effect of the systematic error on analytical results ⇒ Systematic errorsisconstant orproportional ⇒constant errors size • 측정되는 양의 크기에 따라 달라지지 않음 • 절대오차는 시료크기에 대하여 일정 • 상대오차는 시료의 크기에 따라 변함 ⇒proportional errors size •분석에 사용된 시료의 크기에 따라 증가 또는 감소 • 절대오차는 시료크기에 따라 변함 • 상대오차는 시료의 크기에 대하여 일정
Detection of systematic instrumental & personal errors ⇒ Instrumental error • can be founded and corrected by calibration • periodical calibration • Instrumental error by interferences in samples → 단순한 검정으로 영향제거 불가능 ⇒Personal error • It can be minimize by precaution, excise, etc. • Check instrument reading, notebook entries & calculations • chose the adequate method -- errorminimizing
Detection of systematic method errors ■ Method errors Analysis of standard samples ⇒The best way of estimating the bias of analytical method is by the analysis of standard reference materials(SRMs) ⇒SRMs : 정확하게 잘 알려진 농도를 가지고 있는 analytes를 하나 또는 그 이상 포함한 물질 ⇒합성하여 사용 • 순수한 성분들을 혼합하여 조성을 알 수 있는 균일시료 제조 • 합성 표준물질의 조성은 분석시료의 조성과 거의 같아야 함 • 표준시료의 합성이 불가능하거나, 쉽지 않고 시간이 많이 걸리는 경우 가 있음 → 실제적이지 못할 수 있음 ⇒• 미국 정부기관인 NIST(National Institute od Standards & Technology)에서 1300 종 이상의 SRMs 공급 •몇몇 시판 공급회사에서도 공급
http://ts.nist.gov/measurementservices/referencematerials/index.cfmhttp://ts.nist.gov/measurementservices/referencematerials/index.cfm
105.4 Toxic Substances in Urine (powder form) SRMs 2670a, 2671a and 2672a are for determining toxic substances in human urine. They consist of freeze-dried urine and are provided in sets of four 30 mL bottles -- two each at low and elevated levels. NOTE:The values listed for these SRMs apply only to reconstituted urine.
■ Independent analysis ⇒ 표준시료를 사용할 수 없을 경우 ⇒ 같은 시료를 또 다른 독립적이고 신뢰성 있는 분석법으로 분석 (parallel analysis) ⇒두 방법은 가능한 한 많이 달라야 함 → 두 방법에 모두 영향을 줄 수 있는 공통요인을 최소화 하기 위함 ⇒ 두 방법간의 차이가 random error 또는 방법에서 오는 bias 때문인지를 평가하기 위해 반드시 통계적 test를 실시 (7B-2)
■ Blank determinations ⇒ blank • reagents and solvents without analyte. • Similar condition of analyte environment (sample matrix): - >addition of sample constituents. ⇒blank determination • every step in analysis : blank material analysis needs.
Precision and Accuracy Precision describes the reproducibility of a result, if you measure A quantity several time and the values agree closely with on another your measurement is precise. Accrue describes how close a measured value is to the “true” value If a known stands is available , accuracy hoe close your value is to the known value.
Precision ⇒ 측정의 재현성(reproducibility of measurements) ⇒ 정확히 똑같은 방법을 이용하여 얻은 측정값들 사이의 일치성 ⇒반복시료를 사용하여 반복적인 측정을 함 • Three terms to describe the precision • Standard deviation • Variance • Coefficient of variance (분산계수) ⇒ deviation from the mean (di)의 함수.
Absolute and Relative uncertainty Absolute uncertainty expresses the margin of uncertainty associated with a measurement. Relative uncertainty compares the size of the absolute uncertainty with the size of its associated measurement.
3-4 Propagation of Uncertainty from Random Error We can usually estimate or measure the random error associated with measurement, such as the length of an object or the temperature of a solution. - Addition and Subtraction 1.76 (± 0.03) + 1.89 (±0.02) -0.59(±0.02) 3.06(±e4) e1 e2 e3 Percent relative uncertainty=0.041 / 3.06 × 100= 1.3% 3.06 (± 0.04): absolute uncertainty, 3.06 (± 1 %): relative uncertainty
Exponents and logarithms Uncertainty for powers and roots: (3-7) Uncertainty for logarithm: (3-8) (3-9) Uncertainty for Natural logarihm (3-10) Uncertainty For 10x: Uncertainty for ex (3-11)
3-5 Propagation of Uncertainty from Systematic Error The standard deviation ( defined in section 4-1 ) for this distribution, Also called the standard uncertainty , is ±a√3= ±0.0003/ √3= ±0.00017
MultipleDeliveries From One Pipet: The Triangular Distribution The standard uncertainty ( standard deviation) in the triangular Distribution is ± a √6 = ±0.03 √6= ±0.012ml The standard uncertainty is ±4 × 0.012= ±0.048 ml , not ± √0.012 2 + 0.012 2 +0.012 2 + 0.012 2= ±0.024ml Calibration improves certainty by removing the systematic error