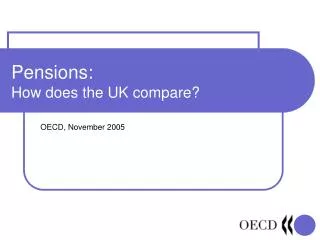
Pensions: How does the UK compare?
Pensions: How does the UK compare?. OECD, November 2005. Net replacement rate: average earner. Luxembourg. Italy. Germany. France. OECD average. Japan. Canada. Australia. United States. United Kingdom. Ireland. 0. 25. 50. 75. 100. 125.

Pensions: How does the UK compare?
E N D
Presentation Transcript
Pensions:How does the UK compare? OECD, November 2005
Net replacement rate: average earner Luxembourg Italy Germany France OECD average Japan Canada Australia United States United Kingdom Ireland 0 25 50 75 100 125 Net replacement rate (pension/earnings, per cent
Net replacement rate: low earner Luxembourg France Canada Italy OECD average Japan United Kingdom Australia Ireland Germany United States 0 25 50 75 100 125 Net replacement rate (pension/earnings), individual on half average earnings, per cent
Older people’s relative incomes United States Canada Netherlands Luxembourg Japan Germany France OECD average Italy New Zealand Ireland United Kingdom Australia 0 25 50 75 100 Net income of 66-75 year olds, per cent of overall average income
Old-age poverty Ireland Australia United States Japan Italy United Kingdom OECD average France Germany Canada Luxembourg Netherlands New Zealand 0 5 10 15 20 25 30 Percentage of 66-75 year olds with income below half median population income
Fiscal projections Italy France Germany OECD average Japan Netherlands Canada New Zealand United States 0 United Kingdom Australia 0 5 10 15 20 Current and 2050 old-age pension spending, per cent of GDP
Sources and further reading • Pensions at a Glance: Public Policies across OECD Countries, OECD, 2005 • ‘Income distribution and poverty in OECD Countries in the second half of the 1990s’, by Michael Förster and Marco Mira d'Ercole, Social, Employment and Migration working paper no. 22, OECD, 2005 • ‘Fiscal implications of ageing: projections of age-related spending’, by Thai Thanh Dang, Pablo Antolín and Howard Oxley, Economics Department working paper no. 305, OECD, 2001 • Ageing and Employment Policies: United Kingdom, OECD, 2005 • Ageing and Income – Financial Resources and Retirement in Nine OECD Countries, OECD, 2001
Contact information • Edward Whitehouse • +33 1 45 24 80 79 • edward.whitehouse@oecd.org • ELS/SPDOECD2 rue Andre PascalParis 75775 France • Internet: www.oecd.org/ageing