Download
1 / 20
200 likes | 258 Vues
Understand the dose-response relationship in drug actions through graded and quantal dose-response curves, including concepts like ED50, LD50, and therapeutic index. Explore how drug structure influences pharmacological properties for improved therapeutic outcomes.

E N D
QUANTITATIVE ASPECTS OF DRUG ACTIONS DR. SHABANA ALI
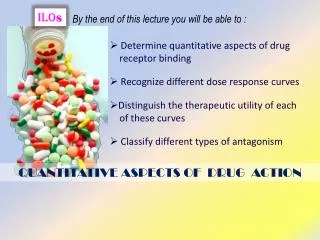
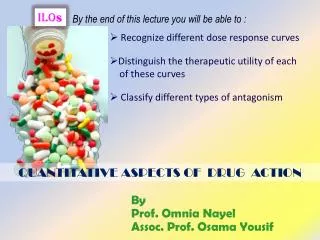
QUANTITATIVE ASPECTS OF DRUG ACTIONS Quantitative aspects are important for mode of use e.g. dose-response relationship Dose-Response Relationship of agonists • Relationship between amount of drug administered in plasma and magnitude of desired response cont.
A given dose of drug produces measurable degree of action in a biological system (sm.muscle or whole animal) Types of DRC • Two types • Graded Dose-Response • Quantal Dose-Response
1) GRADED DOSE-RESPONSE • When dose of drug response also e.g., contraction or relaxation of muscles, ∆ BP, ∆ blood sugar etc. • Studied in vitro on a piece of small intestine • Relationship b/w dose & response can be plotted on curve (x-axis=dose; y-axis=response) • Conc./dose on arithmetic scale, curve is hyperbolic (not linear relationship) • Conc./dose on log scale, curve is sigmoid-shaped (semi log dose-response curve)
Effect of various conc. of ACh on isolated small intestine of rabbit showing graded response
Advantages of semi log Dose-Response Curve • Wide range of drug doses is depicted • Easy comparison between agonists • Easy study of antagonists • The middle portion (25-75%) • of curve is linear; direct • relationship between dose • and response can be obtained
GRADED DOSE-RESPONSE CURVE Following valuable data can be drawn Threshold dose: dose which produces first noticeable response ED50/EC50(median effective dose or concentration):Dose or conc. which produces 50% of maximal response Cont.
Drugs with same action at a receptor but with d/f potency show parallel DRC • Potencies of two drugs can be compared by ED50 ED100/EDmax (ceiling effect): Conc. which produces maximal response
2) QUANTAL DOSE-RESPONSE • Response follow all or none phenomenon (e.g., analgesics, convulsants, anticonvulsant activity, death etc) • Dose of drug evokes a fixed pharmacological response • Studied in whole animal (in vivo); data derived from group of animals or population
Results can be plotted as Log dose-percentage curve • Gaussian Distribution Curve (sigmoid > graded response) is obtained by keeping log doses on horizontal-axis and % response on vertical-axis
Following valuable data can be drawn from Quantal Dose Response curve A) Median Effective Dose (ED50) Dose of a drug required to produce 50% of maximum response B) Median lethal dose (LD50) Dose of a drug required to kill 50% of experimental animals; measurement of toxicity
C) Median toxic dose (TD50) Dose producing toxicity in 50% animals or humans D) Therapeutic Index Ratio of the median lethal dose to median effective dose CONT.
Therapeutic Index (TI) =LD50 / ED50 e.g. digoxin & warfarin have TI; Penicillin = TI Based on median doses; not about slope of DRC for therapeutic or toxic doses Approximate assessment of safety of the drug TI safer is drug &vice versa
E) Margin of safety Ratio of LD 0.1 / ED 99.9 LD0.1=min. lethal dose for 0.1 % of population; ED99.9%=minimum effective dose for 99.9 % of population
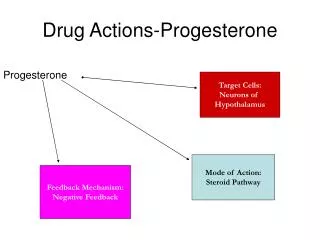
STRUCTURE-ACTIVITY RELATIONSHIP • Study of chemical structure of drug and its relationship with its pharmacological action • Both affinity & efficacy of drug r determined by its chemical structure • Minor change in drug molecule major change in pharmacological property cont.
Significance of structure-activity relationship • Synthesis of • Valuable therapeutic agent from parent compound • Drug with wide margin of safety • Drug with selectivity for tissues • Useful therapeutic antagonist of hormone or neurotransmitter • Improvement of PK property • Drug designing, identification of receptors, size, shape, position, orientation of charged groups or H+ bond donors
Improved affinity and selectivity for receptors E.g., Chlorpromazine (antipsychotic) trifluoperazine • Procaine (antiarrhythmic) procainamide (resistant to hydrolysis) • Benzyl pencillin (antibiotic) phenoxymthylpencillin, ampicillin, amoxycillin (resistant to HCl) • Atropine (mydriatic) Homatropine (less lasting effect)