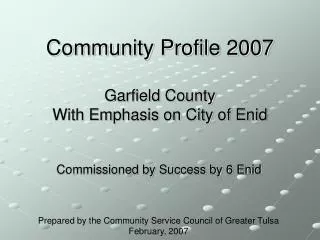
Community Profile: Tulsa County
Community Profile: Tulsa County. FOCUS ON WOMEN. Prepared by the Community Service Council, with support from the Metropolitan Human Services Commission Presented to The Mayor’s Commission on the Status of Women August 3, 2013. Demographic trends. Total population Sex Age


Community Profile: Tulsa County
E N D
Presentation Transcript
Community Profile: Tulsa County FOCUS ON WOMEN Prepared by the Community Service Council, with support from the Metropolitan Human Services Commission Presented to The Mayor’s Commission on the Status of Women August 3, 2013
Demographic trends Total population Sex Age Race and Hispanic Origin
Distribution of population by age by sex: tulsa county, 2012 Source: US Census Bureau, 2012 Population Estimates.
Gender differences in life expectancy • Life expectancy for men and women in 1920 was 1 year difference • Life expectancy for men and women in 1990 was 7 years difference • Life expectancy for men and women in 2011 is 5 years difference • At birth, there are more males than females. By age 36, the trend turns to more females than males. At age 100, women outnumber men by 8 to 1
Life expectancy by sex: U.S., 1900 to 2011, and tulsa county, 2009 Source: US Census Bureau, 2012 Population Estimates.
Distribution of Children Under Age 5 by race and hispanic origin: Tulsa county, 2000 & 2010 +7.9% -14.1% +113.5% -9.3% +57.9% +17.4% +51.7% Source: US Census Bureau, 2000 and 2010 Censuses.
Marital status among women age 20 and over: Tulsa county, 2011 Source: US Census Bureau, 2011 American Community Survey.
Family Type for Children under Age 6 by Race and Ethnicity, tulsa county 2010 Source: US Census Bureau, 2010 Census.
Incarceration of women • Oklahoma has the highest female incarceration rate among states at 132/100,000 – almost double national average (68) • 2,700 Oklahoma women were incarcerated in 2011 • 67% for non-violent offenses • 3% of Oklahoma children have at least one parent in prison • Children with an incarcerated parent are five times more likely to spend time in prison themselves • Average length of stay is 1.9 years • 3 year recidivism rate is 14.4% • Offense categories (fy2010 receptions) • Possession/obtaining CDS: 23.8% • Distribution CDS: 19.1% • Forgery: 8.5% • Larceny: 7.1% • Assault: 7.0%
Placement of children of incarcerated mothers in oklahoma Source:
Live Births by Race/Hispanic Origin, Tulsa County, 1991-2008 Source: Oklahoma State Department of Health (OK2SHARE). Prepared by the Community Service Council, with support from the Metropolitan Human Services Commission (11/2012).
Total Fertility Rates by Race/Hispanic Origin, Tulsa County, 1991-2008 Source: Oklahoma State Department of Health (OK2SHARE).
Births by Mother’s Education Level for Tulsa County, 2008 (35.3%) (23.2%) (23.5%) (18.0%) Source: Oklahoma State Department of Health (OK2SHARE).
Women as caregivers • Total of 65.7 million caregivers in the US (29% of adult population) • An estimated 66% of caregivers are women • The average caregiver age is 48
Oklahoma rankings on indicators of child well-being Source: Annie E. Casey Foundation, “KIDS COUNT Data Book, 2013.”
Oklahoma rankings on specific child indicators Source: Annie E. Casey Foundation, “KIDS COUNT Data Book, 2013.”
The Adverse Childhood Experiences (ACE) Study Pyramid Death Conception Mechanisms by which Adverse Childhood Experiences Influence Health and Well-being throughout the Lifespan Source: The Adverse Childhood Experiences Study website: www.acestudy.org, “About the Adverse Childhood Experiences Study.”
Adverse Childhood Experiences… …DISEASE, DISABILITY AND SOCIAL PROBLEMS IN ADULTHOOD …growing up in a household with ADVERSE CHILDHOOD EXPERIENCES: • Recurrent physical abuse • Recurrent emotional abuse • Sexual abuse • An alcohol or drug abuser • An incarcerated household member • Someone who is chronically depressed, suicidal, institutionalized or mentally ill • Mother being treated violently • Living with one or neither parent • Emotional or physical neglect • Smoking • Overeating • Physical inactivity • Heavy alcohol use • Drug use • Promiscuity • Nicotine addiction • Alcoholism • Drug addiction • Obesity • Depression • Suicide • Injuries • Unintentional pregnancy • Adolescent pregnancy • Heart disease • Cancer • Chronic lung and liver disease • Stroke • Diabetes • Fetal death • Sexually transmitted diseases …ADOPTION OF HEALTH RISK BEHAVIORS… Source: The Adverse Childhood Experiences Study website: www.acestudy.org, “What are Adverse Childhood Experieinces (ACE’s).”
Adverse Childhood ExperiencesCounty Rankings Rankings: 1 = best, 77 = worst *Indicates a tie with at least one other county Source: Oklahoma KIDS COUNT Factbook, 2006-2007, Oklahoma Institute for Child Advocacy
Domestic violence • A woman is assaulted or beaten every 9 seconds in the US • Nationally, 1 in 4 women and 1 in 7 men have experienced severe physical violence by an intimate partner • 876 homicides due to domestic violence identified from 1998 to 2008 in Oklahoma • Men who as children witnessed their parents’ domestic violence were twice as likely to abuse their own wives than sons of nonviolent parents
Percentage of 4th graders not proficient in reading by race and hispanic origin: United states: 2011 Source: Annie E. Casey Foundation, “KIDS COUNT Data Book, 2013.”
High school graduation rates: tulsa public schools, 2011-12 school year Source: Oklahoma State Department of Education, Office of Accountability, 2011-12 AMO (Annual Measurable Objectives); Oklahoma State Department of Education ”no child Left Behind Act” Annual Report Card 2010-11.
The aging population in Tulsa County is predominantly female, many live alone and over a third have a disability Source: US Census Bureau, 2011 American Community Survey.
Living arrangements of persons 65 and older: Tulsa county, 2011 3.8% 2.1% 28.7% 65.4% Source: US Census Bureau, 2011 American Community Survey.
Economic conditions Labor force participation Living wage and poverty Role of education Program participation Income inequality
Civilian Labor Force Participation Rates for Persons 16 & Older by Sex 68.2% 62.5% 57.1% Source: Toossi, Mitra. “Employment Outlook: 2010-2020: Labor Force Projections to 2020: A More Slowly Growing Workforce,” Monthly Labor Review, January 2012. Prepared by the Community Service Council, with support from the Metropolitan Human Services Commission (5/20/2013).
Civilian Labor Force Participation Rates among Persons 16 to 19 by Sex 27.9% 26.5% 25.2% Source: Toossi, Mitra. “Employment Outlook: 2010-2020: Labor Force Projections to 2020: A More Slowly Growing Workforce,” Monthly Labor Review, January 2012. Prepared by the Community Service Council, with support from the Metropolitan Human Services Commission (5/20/2013).
Civilian Labor Force Participation Rates among Persons 20 to 24 by Sex 69.4% 65.9% 62.3% Source: Toossi, Mitra. “Employment Outlook: 2010-2020: Labor Force Projections to 2020: A More Slowly Growing Workforce,” Monthly Labor Review, January 2012. Prepared by the Community Service Council, with support from the Metropolitan Human Services Commission (5/20/2013).
Civilian Labor Force Participation Rates among Persons 25 to 54 by Sex 88.1% 81.3% 74.6% Source: Toossi, Mitra. “Employment Outlook: 2010-2020: Labor Force Projections to 2020: A More Slowly Growing Workforce,” Monthly Labor Review, January 2012. Prepared by the Community Service Council, with support from the Metropolitan Human Services Commission (5/20/2013).