Download
1 / 55
550 likes | 701 Vues
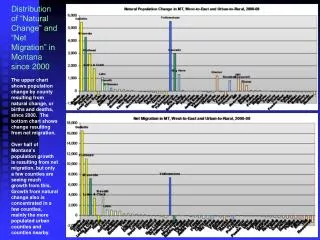
Distribution of “Natural Change” and “Net Migration” in Montana since 2000 The upper chart shows population change by county resulting from natural change, or births and deaths, since 2000. The bottom chart shows change resulting from net migration.

E N D
Distribution of “Natural Change” and “Net Migration” in Montana since 2000 The upper chart shows population change by county resulting from natural change, or births and deaths, since 2000. The bottom chart shows change resulting from net migration. Over half of Montana’s population growth is resulting from net migration, but only a few counties are seeing much growth from this. Growth from natural change also is concentrated in a few counties, mainly the more populated urban counties and counties nearby.
Past and Projected Population Growth among Montana’s Ten Sub-regions The chart shows sub-regional population growth, past and projected, for the ten sub-regions of Montana that are mainly centered around major population centers. The two most populated ones are the Billings sub-region, which will reach 220,000 people by 2025, and the Missoula sub-region, which will increase to over 240,000 people by 2025. The combined population of the 5-county area centered around Missoula will have a larger population than the 10-county area centered around Billings by or shortly after 2010. The populations of the Bozeman and Flathead sub-regions will each reach about 150,000 people by 2025 according to these population projections. The populations of both of these fast-growing sub-regions will move past the population of the more expansive Great Falls sub-region by or before 2015. Population growth in Montana has centered around its main regional population centers, although these are growing are differing rates.
Age Shifts Among the U.S. Population The upper chart shows the number of people living in the U.S. by single age in 1990 and ten years later in 2000. The lower chart then shows changes in the number of persons for each age during the decade of the ‘90s. The greatest growth in the population occurred among persons in their early 40s to early 60s. These are classic “baby boomers” or persons born after W.W. II between 1947 and 1963. The tremendous rise in the number of births during this post-war period has skewed the distribution of the U.S. population, making baby boomers the largest age group among the population. The next largest is the children of boomers or the “echo” group. These bulges in the U.S. population age profile are continuing to ripple forward and are contributing to the accelerated aging of the population.
Changing Age Features of the Rocky Mountain West Population The chart shows population counts by single ages for persons under 1 year of age up to age 84 for the last two Censuses – 1990 and 2000. The figures in the chart combine state totals for the five Rocky Mountain states. Population growth in the period was concentrated among adults between their late 30s and late 50s – classic “baby boomers,” or persons born between 1946 and 1964. Growth also was focused among young adults in their early and mid- 20s and among older children and teen-age children, or what is often referred to as the baby boom “echo.” In looking forward toward the 2010 Census, the large population in their late 30s to late 50s, will shift to their late 40s to late 60s, moving steadily toward retirement ages and continue shifting. And the younger population concentrated in their late teens and early 20s will shift to late 20s and early 30s.
Montana Population by Age, 1990 vs. 2000 The upper chart shows the number of persons residing in Montana by single age from youngest to oldest in 1990 and ten years later in 2000. The lower chart shows how population changed for each age during this ten-year period. Most of the state’s population growth during the ‘90s was among persons at ages between their early 40s and late 50s – classic “baby boomers” or persons born between 1947 and 1963. Some population growth also concentrated among children and young adults between the ages of 12 and 25. This latter group is the children of baby boomers or the boomer “Echo” population. Considerable population decline actually occurred for persons at ages between the boomer group and echo group. There also was a fall-off in population for young children. These “ripples” or “waves” in the population age profile will continue to play out in the future.
Projected Shifts in the Population of Montana by Age The upper chart shows how population changed in Montana by single age from youngest to oldest between 1990 and 2000. The lower chart shows how population is projected to change by the U.S. Census Bureau (March, 2005, projections) between 2000 and 2010. The growth in population that was concentrated among persons between their early 40s and late 50s in the ‘90s is projected to be concentrated between persons in their early 50s to late 60s in the current decade. The echo population also will continue to age, shifting growth to persons between their early 20s and mid-30s. And during the current decade the “echo-echo” population will come into being, reflected in the recent increase in births.
Projected Popu-lation Growth by Age in the Next Decade – 2010 to 2020 The chart at the right shows how Montana’s population is projected to change by age between 2010 and 2020. During the next decade growth in the state’s population will shift to persons in their early 60s to late 70s and Montana is in fact projected to have one of the largest populations 65 and older as a percent of its total by 2020. The echo group or the children of boomers is shown in growth among persons from their early 30s to mid 40s. However, this echo group is projected by the Census Bureau to be much smaller than the boomer group. In turn, the “echo-echo” group is projected to be much smaller than the echo group. As we look out in front of us, we can see that population growth will continue to manifest itself in ripples and waves, with each successive wave of growth smaller than its immediate predecessor. This pattern of growth has significant implications. The fastest growth will occur among seniors and health care demand will continue to rise and housing needs will change. The number of persons at will move up and down at ages where college students are primarily drawn, as well as for high schools and elementary schools. The labor force of Montana will very likely shrink in size in the future as more and more persons leave the workforce for retirement and there are not enough persons entering the workforce to replace them.
Future Pop. Change in Montana by Age Grouping The projected aging of Montana’s population over the next 20 years can be viewed by examining how the population is expected to change by age grouping. The upper chart shows the population under 18 (high school and younger), the population 18 to 33 (young post-high school adults and those at ages of family formation and childrearing), the population 34 to 49 (young and middle-age adults), the population 50 to 64 (older adults at pre-retirement ages), and the population 65 and older. The under 18 population, which grew by only 3% in the ‘90s, is projected to fall by 8% between 2000 and 2010, then grow slightly in the subsequent two decades. The young adult population, which saw very little change in the last decade, would grow by 10% in the current decade before declining in each of the subsequent periods. The older adult working age population between 50 and 64, which saw massive growth in the ‘90s will also see very high growth in the current period before beginning a decline. And the 65 and older population, which grew by only 13% in the ‘90s, will grow by 20%, 46%, and 27% in the subsequent three decades. As a result of these age shifts, Montana will have one of the largest populations over 65 of any state in the country in future years.
Past and Projected Civilian Labor Force in Montana using Census Bureau 2005 Population Projections The labor force is primarily composed of adults between the ages of 18 and 64. The chart at the right shows past and projected population, as currently projected for Montana by the U.S. Census Bureau (2005 projections). Also shown are past and projected populations for persons 18 to 64. While the total population is projected to continue increasing, the population between 18 and 64 is projected to plateau in 2011 through 2013, then begin a gradual decline. The ratio between the total civilian labor force in Montana and the state’s population 18 to 64 was 86% in 1990 and 85% in 2000. This ratio has been fairly stable over time. Extending this ratio forward and applying it to these population projections provide rough estimates of the size of Montana’s civilian labor force in the future as these population and age projections unfold. Because the work force age group of the population peaks and begins to decline after 2011, so should the total size of the civilian labor force. As can be seen, it will rise from 500,000 in 2005 to about 520,000 in 2010, then plateau and slightly decline to 518,000 in 2015. This decline would continue through 2030. In projecting future growth in the state’s labor force, it is very important to factor in how labor force expansion in the state may be constrained by shifting age demographics. If the population at prime ages of work force participation is not growing, then the labor force itself cannot grow. And if labor force expansion is constrained, so will be employment and labor earnings growth. At the national level there is a growing appreciation of how changing age demographics will constrain expansion of the labor force. However, in states like Montana with older populations than the nation as a whole, there is little appreciation of how this same phenomena could result in an actual decline in the state’s labor force in future years.
Slowing Population Growth due to Aging in the Region Montana’s population is aging, but so is the population of the U.S. more generally. However, Montana’s population is expected to age more quickly than the U.S. as a whole largely because so much of the state’s recent growth is concentrated among baby boomers. The percent of the population 65 and older in Montana will rise from 13.4 percent at the time Of the 2000 Census to nearly 26 percent by 2030 according to projections by the U.S. Census Bureau. Montana and Wyoming are projected to become two of the four oldest populations in the U.S. over the course of the next two decades. Because population growth is expected to concentrate among older adults, birth rates will fall as death rates rise. This combined with future expectations regarding net migration translate into steadily falling rates of population growth in Montana and throughout the region.
Slowing Growth in the Region Tied to Population Aging Some of the growth in the larger region can be attributed to the role that the large segment of our population referred to as “baby boomers” played in both migration patterns and in family formation and child-rearing. They were among the most “footloose” among the population as mobility increased and many moved families with them when they did move. But as they age family size is shrinking and migration patterns are shifting again. Assumptions made by U.S. Census Bureau analysts show that population growth among states in the region has slowed since the ‘90s and for several states will continue to slow further in future decades. Idaho, growing in population by 28% in the '90s, is projected to fall to 17% growth over the current decade, followed by growth of 15% and 13% in the subsequent two decades. Montana falls from 13% to 7% and then to 6% and 2%, under these Census Bureau projections. Both Oregon and Washington fall from relatively high growth rates in the ‘90s in the current decade, but then are projected to gradually reaccelerate. The U.S. population as a whole slows in growth from 13% to 9% and then growth stabilizes, with future growth projections heavily reflecting assumptions about International net migration. Population growth among Interior West states slows mainly because their growth has been driven by “domestic” net migration – movement to the area from other places in the U.S.
How Population Aging is affecting Birth & Death Trends in Montana By simply looking at long-term trends in the number of births and number of deaths statewide in Montana over time, you can see some of the effects of population aging. The chart shows the total number of births by residents of Montana since the mid-‘50s through 2007. Births actually peaks back in 1957 and have never returned to that level again. This peak was associated with the peak in births by today’s “baby boomers.” Births once again rose to another relative high in 1981 and this peak was associated with the time when boomers themselves were having kids. The more recent smaller bubble that may continue to rise is associated with the kids of boomers now having kids themselves. As the population continues to age, deaths are steadily rising and these will begin to rise more rapidly as boomers reach 65 and older over the next decade.
“Natural Population Change” in Montana – Urban-to-Rural The chart shows net population change as a result of only births and deaths in Montana for the seven urban or regional center counties, for counties nearby these centers, and for the rest of the more rural counties in the state. Most of the population growth now occurring in Montana from natural change is happening in the seven more urban centers. Very little population growth is happening in the more rural areas of the state, even though births are slightly up with the emergence of the “echo-echo” group, or the children of the children of boomers. In the future as birth rates fall, natural change in most of Montana’s more rural areas will go “negative,” that is, there will be more deaths than births, and this negative natural change will add to the already existing population loss occurring because of negative “net migration” in most of these rural areas.
Labor Force and Employment Growth by Region in Montana, West-to-East The chart shows monthly labor force and employment levels for counties in Montana’s three major regions – the Western Mountain region, the Central Front region, and the Eastern Plains region. Most of the growth in the labor force and employment in Montana is concentrated in the west where the labor force has steadily grown from 225,000 in the early ‘90s to almost 310,000 more recently. Some of the growth is occurring along the Central Front, a region containing Great Falls and Billings. Here the labor force has grown from 135,000 in the early ‘90s to almost 156,000 in the last year. In the Eastern Plains the labor force grew from 58,000 in the early ‘90s to over 59,000 in the latter part of the decade. Since then the work force in the east has gradually shrunk to about 49,000.
Trends in Births-Deaths in Montana – West vs. East The upper chart shows total births and deaths each year in the western mountain region of Montana since the late ‘70s. The lower chart shows the same for counties in eastern Montana. Birth totals in the west have recovered to levels in the early ‘80s. However, in the east, total births have risen modestly but are well below levels in the early ‘80s when the current “echo” age group was being born. The difference between births and deaths is what is called “natural change” and western Montana is currently adding more and more people through natural change as the “echo-echo” group is being born. This should continue for a few more years. And as births eventually begin to decline, deaths will continue rising.
Recent Changes in Montana’s Younger Population – Regional Center Cos. Versus Rest of State The younger population is being “regenerated” in most of Montana’s urban centers. However, this isn’t the case in most of Montana outside these regional centers. The upper chart shows population change among segments of the younger population in the seven regional center counties. The bottom chart shows change in the rest of Montana outside these centers. The “echo-echo” group is taking shape in Montana’s regional centers with year-to-year growth in the under 5 population. And this is translating into a turnaround in decline among older children. However, this isn’t happening in the more rural areas.
Personal Income Growth among States, 1990 – 2007 Taken as a group and as a single region, the Rocky Mountain West has the fastest growing economy in the U.S., as measured in total personal income growth since 1990. Four of the five Rocky Mountain West states are among the top six states in income growth and the 5th, Montana, is ranked 13th among states in income growth. This pace of growth in income over the last two decades propelled Montana and other Rocky Mountain West states through the early stages of the national recession. While this growth has slowed in the region, a similar pattern of growth will largely emerge as the national slowdown subsides over the next year or so.
Personal Income Expansion in Montana Over Time The upper chart shows levels of total personal income for Montana since 1980 with figures in millions of 2005 inflation-adjusted dollars. Income totaled almost $16 billion in 1982, rose only slightly to over $16 billion in 1988, but since then has seen almost uninterrupted expansion. Income surpassed $18 billion in 1992, then accelerated to over $24 billion in 2002. Growth has continued since then and reached almost $29.5 billion in 2007. The lower chart examines this income growth for 5-year periods over time. Income grew by less than half a billion dollars between 1982 and 1987. Its growth then picked up, rising by $1.7 between 1987 and 1992. Growth has accelerated in each successive 5-year period since, rising by $2.6 billion, then $3.8 billion, and by $4.9 billion in the most recent period from 2002 to 2007.
Urban-to-Rural Distribution of Personal Income Growth in Montana The upper chart shows the distribution of recent total personal income growth in Montana between 1996 and 2006 by county with counties arrayed from left to right by urban-rural grouping and by amount of income growth. Income grew by $12.3 billion between 1996 and 2006 in nominal dollars. Of this growth, $8.7 billion occurred in the seven regional centers (over 70% of the total), and another $2.6 billion in growth occurred in the 27 counties nearby these regional centers (21%). The remaining 8% of income growth was accounted for by the other 22 more rural and isolated counties in Montana.
Total Employment Growth among States, 1990-2007 Four of the five Rocky Mountain West states are among the top ten states with the fastest growing employment since 1990 and the 5th, Wyoming, is ranked 11th. The economies of all these states are not only growing, but changing and restructuring.
Total Employment Expansion in Montana Over Time The upper chart shows levels of total employment for Montana since 1980. These figures include all full- and part-time jobs in Montana during a year. Employment growth was relatively flat in the ‘80s, but since the late ‘80s, growth has been steady. The lower chart shows employment growth for 5-year periods dating back to the early ‘80s up until last year. The total number of jobs grew by only 16,000 between 1982 and 1987 and then job growth accelerated in each of the next two 5-year periods, before slowing in the latter ‘90s. Job growth has re-accelerated in the more recent 5-year period.
Urban-to-Rural Distribution of Employment Growth in Montana The upper chart shows the distribution of recent employment growth in Montana between 1996 and 2006, as measured by the Bureau of Economic Analysis (BEA), U.S. Commerce Department. Counties are arrayed from left to right based upon their urban-rural grouping and by employment growth. The lower chart then shows employment change over this ten-year period for the three county groupings. Jobs increased by 115,000 over this period, with 86,815 of this job growth (nearly 76%) occurring in the seven regional center counties. About 21% of the growth (23,578 jobs) was in counties nearby these centers. The remainder (less than 4%) was in rural counties.
Labor Force Expansion in Montana by County, Urban-to-Rural Labor force growth has become increasingly constrained in Montana and in the larger region with the tightening labor market. And labor force growth is fairly concentrated in a relatively small number of counties. The chart shows labor force growth among all of Montana’s counties during the 8-year period from July, 2000, to July, 2008. It is during this period that area unemployment rates fell considerably, in many areas to around 2%. Regional center counties are shown at the left in the chart, followed by counties nearby these centers, followed for more isolated and rural counties. The lower chart then shows labor force change in the state for these three county groupings. Most labor force growth is in regional centers.
Framework for Community & Regional Development • Develop Sub-state, City- and Region-based Strategies Successful, economic development initiatives must reflect underlying and emerging area strengths and weaknesses. Don’t look to “one-size-fits-all” development strategies to pursue your future. Look to yourself. • Attend to Key Foundations for Future Economic Success Keys to economic success extend beyond business development and assistance. For cities and regions to be competitive, they must have: • Quality Infrastructure: streets, water, sewer, schools, parks, neighborhoods, office buildings and complexes, • business centers, communications, transportation, educational facilities, cultural amenities, etc. Develop a • “vision” for what you want and put it into place. • Quality Workforces: adaptive well-stratified workforces, with access to good training and education tailored to particular needs and opportunities of area employers. Area education and economic development providers must work in tandem in devising area workforce training programs. • Devise “Side-by-Side” Strategies for Business Development and Workforce Development using Clusters Don’t try to decipher business assistance and workforce needs of hundreds of employers all as one. Stratify current and potential employers in the area into “clusters” and customize strategies for each cluster. • Chart and Assess Your Progress using “Peers” Understanding change in your own community requires understanding change in the larger region and among cities and regions like yours. • Establish an “Area Economic Development Roundtable” Area economic success requires a combination of strategies for business assistance, education, workforce development, infrastructure, and city planning. Key leadership across this array of programming must regularly meet in order that this type of multi-faceted approach can be developed, inter-coordinated, pursued and continually assessed. • - Larry Swanson, O’Connor Center for the Rocky Mountain West, U. of MT
Challenges for Workforce Development and Adult Education Programming In an increasingly “human-resource based” economy, workforce development and education have become centerpieces of any strategy for community economic improvement. They are essential for economic prosperity . Regionally-based and Customized: Workforce development programs must be grounded in the region and communities served .. tailored to particular needs and opportunities of area employers. Be “strategic”. Inter-coordinated: Workforce development and training, education more generally, business technical and financial assistance, marketing assistance and promotion, infrastructure development, and other aspects of community development … must be inter-coordinated. Well-designed and Adaptive:The economy is continually restructuring and changing. To be successful workforce development programming must reflect where the economy is going, not where it has been. Be “forward-looking” and “opportunistic”. Life-long:The pace of economic change combined with the aging of the workforce require that workforce development itself be life-long. Develop programming for workers of all ages and for workers who are continually learning and upgrading their skills. Workplace-oriented:Workforce development is something workers need while they work. It is not simply something workers do between jobs or early in life. Make it easy. Place programming in or nearby the workplace. Well-funded:To be successful, workforce development programming must be well-funded. For an area to be competitive, area workforce development programming cannot be done “on the cheap.” - Larry Swanson, O’Connor Center for the Rocky Mountain West, U. of MT