

E N D
Presentation Transcript
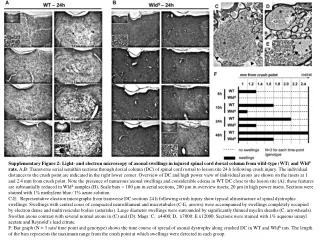
Supplementary Figure 2: Light- and electron microscopy of axonal swellings in injured spinal cord dorsal column from wild-type (WT) and WldS rats. A,B: Transverse serial semithin sections through dorsal column (DC) of spinal cord rostral to lesion site 24 h following crush injury. The individual distances to the crush point are indicated in the right lower corner. Overview of DC and high power view of individual axons are shown on the insets at 1 and 2.4 mm from crush point. Note the presence of numerous axonal swellings and considerable edema in WT DC close to the lesion site (A); these features are substantially reduced in WldS samples (B). Scale bars = 100 μm in serial sections, 200 μm in overview insets; 20 μm in high power insets. Sections were stained with 1% methylene blue ⁄ 1% azure solution. C-E: Representative electron micrographs from transverse DC sections 24 h following crush injury show typical ultrastructure of spinal dystrophic swellings. Swellings with central cores of compacted neurofilament and microtubules (C-E, arrows) were accompanied by swellings completely occupied by electron dense and multivesicular bodies (asterisks). Large diameter swellings were surrounded by significantly thinned myelin sheaths (C, arrowheads). Swollen axons contrast with several normal axons in (C) and (D). Mags: C, x4400; D, x7000; E x12000. Sections were stained with 1% aqueous uranyl acetate and Reynold’s lead citrate. F: Bar graph (N = 3 rats/ time point and genotype) shows the time course of spread of axonal dystrophy along crushed DC in WT and WldS rats. The length of the bars represents the maximum range from the crush point at which swellings were detected in each group.