Download

1 / 36
360 likes | 525 Vues
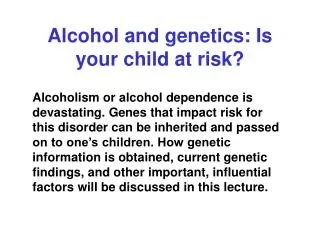
Genetics of Alcohol Response. Addiction Medicine State of the Art Conference October, 2003 Ray White. Alcoholism. Many definitions Precision important for specific studies Working definition: alcohol craving has become encompassing drive

E N D
Genetics of Alcohol Response Addiction Medicine State of the Art Conference October, 2003 Ray White
Alcoholism • Many definitions • Precision important for specific studies • Working definition: • alcohol craving has become encompassing drive • Individual is losing, or has lost, job, family, health • Economic and personal costs astronomical • 10s of thousands of traffic deaths each year • Affect not only individual, but family, bystanders… • Cultural context
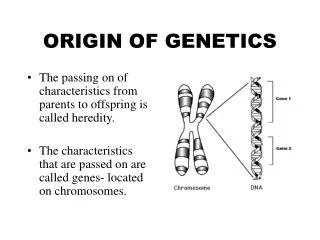
Genetics and Molecular Etiology • Cell and molecular biology describe molecular pathology of disease state • Often cannot distinguish cause from effect or consequence of disease • Important to understand chain of causality in order to intervene • Genetics can define components that are “sufficient” to cause disease • APC gene • Genetics can identify etiologic components not seen by cell, molecular biology analyses • APC gene • Molecular mechanism • Therapeutic targets
Alcoholism Has Genetic Component Twin Pair Concordance Rates M F Heath et al, Psych Med 27:1381 (1997)
* M1 * M1 * M1 * M1 * M1 * M1 * * M1 * M1 * M1 * * M1 * Genes for AlcoholismHow do we find them? • Positional cloning with families • Global scan for disease susceptibility genes (+) • All genes in region become candidates Ascertain family cluster Expand into pedigree Analyze by linkage
* M1 * M1 * M1 * M1 * M1 * M1 * M1 * M1 * M1 * M1 Positional Cloning with Families • Global scan for disease susceptibility genes (+) • All genes in region become candidates L5.79,71,63 L5.63 L5.79,71,63 L5.63 M1 13 13 MCC 12 MCC 12 260 kb 260 kb 11 11 500 kb 500 kb DP1 DP1 11 11 5 mb 5 mb SRP19 100 kb SRP14 100 kb 12 12 30-40 mb 21 30-40 mb 21 * APC 22 22 * 23 23 24 24 25 25 L5.48 L5.48 CHROMOSOME 5
Genes for AlcoholismPositional Cloning with Families Reich et al. Amer. J. Med Gen 81:207 (1998)
Genes for AlcoholismCOGA Replica Set Faroud et al, Alcohol: Clin and Exp Res 24:933 (2000)
Genes for AlcoholismLinkage Mapping in Families: Conclusions and Caveats • Significant linkage findings strongly support genetic component to alcoholism • Broad peaks • Many genes implicated • 20 to 40 genes in most regions • More data does not solve problem • Replication uncertain • Peaks lower, breadth maintained • Only rarely has led to gene identification in complex diseases – • But often in rare, syndromic diseases
Genes for AlcoholismAssociations in Populations SNP1 Dvariant SNP2 SNP3 • Experiment • Genotype SNPs in cases and controls • Expected outcome • Some SNPs show increased frequency among cases • Association of SNP haplotypes identifies chromosome region carrying mutation (Dvariant) causing disease susceptibility High frequency marker SNPs (alleles @ 10% - 50%)
Genes for AlcoholismFunctional Candidates:Associations in Populations • 5 variants – Individuals with family history;% Alcoholism Diagnosis as function of genotype • 5-HT Transporter, • LL–57% SL–21% SS-12.5% ; p=0.04 • 5-HT2A T102C, • 5-HT2A TYR, • 5-HT2C CYS-SER, • GABAAa6 • Pro/Pro-23% Pro/Ser-71% ; p=0.02 Schuckit, M. A., C. Mazzanti, et al. (1999). Biol Psychiatry45(5): 647-51
Genes for AlcoholismAssociation in Populations: Conclusions and Caveats • Common SNP markers may miss variants that are low frequency (1% - 2%) • Most interesting variants may be in the low frequency class
Individual Response to Alcohol Challenge • Broad range of response among individuals • Not explained by pharmacokinetics • Response largely independent of blood alcohol levels • Response ranges from extreme sensitivity to “hollow leg” • Response measured by questionnaire (euphoric feeling…) and by body sway index
Level of Response Heritable Schuckit, M.A., et al., A genome-wide search for genes that relate to a low level of response to alcohol. Alcohol Clin Exp Res, 2001. 25(3): p. 323-9.
Key Finding: Level of Response Predicts Risk of Alcoholism • Entering college students with family history of alcoholism • No strong personal alcohol history • Tested with questionnaire and physiological measures • Followed for extended period • Low response seen in • 40% of children of alcoholics • 10% of family history negative controls • Individuals with a low response to alcohol • 4-fold more likely to become alcoholic • Drink more, hang out with heavy drinking groups • May explain much of inherited alcoholism risk J Stud Alcohol. 1998 Sep;59(5):485-94. Biological, psychological and environmental predictors of the alcoholism risk: a longitudinal study.Schuckit MA
Level of Response Mapping Schuckit, M.A., et al., A genome-wide search for genes that relate to a low level of response to alcohol. Alcohol Clin Exp Res, 2001. 25(3): p. 323-9.
Multipoint Sib-Pair Linkage - Chromosomes 1, 21Sibs from Lower Third of FIRST 5 (SRE) Chromosome 1 Chromosome 21 Schuckit, M.A., et al., A genome-wide search for genes that relate to a low level of response to alcohol. Alcohol Clin Exp Res, 2001. 25(3): p. 323-9.
Mapping Studies: Alcoholism vs Response Level COGA Alcoholism Study Chromosome 1 COGA Level of Response Chromosome 1
Mapping Response Level Genes II Wilhelmsen, K.C., et al., Alcohol Clin Exp Res, 2003. 27(7): p. 1041-7.
Positional Cloning:Not Working in Complex Disease • Too many candidates in linkage • Too much heterogeneity • Locus heterogeneity often lethal for linkage and association approaches • Allelic heterogeneity often kills association • Association needs common variants • New approaches needed - Candidate Genes • Sequencing for rare variants • Isoallelic cohorts for phenotypic characterization
Excellent Candidate Genes for Alcohol Response • Positional Candidates – in chromosomal locations that are implicated in disease • Functional Candidates – in pathways that are implicated in disease process; e.g. (cAMP/PKA) • Model system Candidates – found in animal models to impact alcohol response • Best candidates meet all three criteria
Slide: Anastasia Constantinescu Ion Channels Genes for AlcoholismFunctional Candidates A2R Gs AC cAMP Ca PKA RII Ca Nuclear envelope Ca * CREB cAMP inducible genes CRE
Consumption of ethanol by mutant mice lacking the RII subunit of PKA (RII / ) and wild-type control mice (RII +/+) maintained on a 129 SvJ × C57BL/6 hybrid background. a, Consumption (grams per kilogram) of a 20% ethanol solution. b, Consumption (grams per kilogram per day) at each ethanol solution (8-d average). c, Ethanol preference ratios (volume of ethanol consumed/total fluid consumed) as a measure of relative ethanol preference. All values reported as mean ± SEM. ANOVAs indicated that the RII / mice drank significantly more ethanol than RII +/+ mice. RII / versus RII +/+, *p < 0.05. A Mouse Model: PKA RIIb Knockout Measures of acute sensitivity to the sedative effects of ethanol, consumption of nonalcoholic tastants, and plasma ethanol levels (mean ± SEM). a, Time to regain the righting reflex (minutes) after injection of ethanol (4.0 gm/kg; i.p.). b, Consumption (milliliters per kilograms per day) of solutions containing either sucrose (Suc) or quinine (Qui). c, Plasma ethanol concentration (milligrams per deciliter) either 1 or 3 hr after ethanol injection (4.0 gm/kg; i.p). ANOVAs indicated that RII / mice recovered from ethanol-induced sedation significantly sooner than RII +/+ mice. On the other hand, RII / and RII +/+ mice did not differ significantly in consumption of nonalcoholic tastants or plasma ethanol levels. RII / versus RII +/+, *p < 0.05 Thiele, Todd E., Willis, Brandon, Stadler, Julia, Reynolds, James G., Bernstein, Ilene L., McKnight, G. StanleyJ. Neurosci. 2000 20: 75-
Chromosome 7 Mapping PKA RIIb
Candidate Genes II:Ethanol Consumption by PKCe -/- Mice Reduced responding for ethanol-reinforced lever presses in PKC / mice compared with PKC +/+ mice. (A) Total number of ethanol-reinforced lever presses in a 16-h period, averaged across 8 weeks of testing. PKC / mice (open bars) demonstrated a significantly lower total number of lever presses than PKC +/+ mice (filled bars; t = 2.8, P< 0.05). (B) Total number of ethanol-reinforced lever presses following two different durations of ethanol deprivation. PKC / mice demonstrated a significant reduction in total number of lever presses following 104 h ethanol deprivation compared with PKC +/+ mice [F(1,23)genotype = 7.4, P< 0.05]. In addition, only PKC +/+ mice demonstrated a significant reduction in total number of lever presses following 104 vs. 32 h ethanol deprivation [F(1,23)duration = 21.6, P< 0.01]. (C) Number of ethanol reinforcers per bout were reduced in PKC / mice following 104 h ethanol deprivation compared with wild-type controls [F(1,23)genotype = 5.0, P< 0.05], and decreased as a function of duration of ethanol deprivation period [F(1,23)duration = 9.0, P< 0.05] only in PKC +/+ mice. (Inset) Number of ethanol self-administration bouts did not differ among genotypes, but number of bouts decreased as a function of duration of ethanol deprivation period in both genotypes [F(1,23)duration = 27.3, P< 0.01]. (D) Rate of lever pressing for ethanol reinforcement was significantly reduced in PKC / mice compared with wild-types [F(1,23)genotype = 21.9, P< 0.01]. Similarly, rate of lever pressing decreased as a function of duration of ethanol deprivation period [F(1,23)duration = 8.4, P< 0.05] only in PKC +/+ mice. Data are expressed as mean ± SEM. *Significantly different from 104 h deprivation period. Significantly different from wild-type controls Choi, D. S., D. Wang, et al. (2002). J Neurosci22(22): 9905-11
Genetics of GenesCandidates • Goal is discovery of phenotypes associated with variants in interesting genes • Candidates emerge from • functional analysis – biochemical pathways • Model organisms • Problem: Since most interesting variants <1%-2% frequency, usually see only one example • Risky to draw conclusions from one example • Need an isoallelic cohort -analogous to mouse knockouts • 25 – 50 subjects who carry same rare allele
Genetics of Genes: Bottom-UpDriven by Gene Activity –Phenotype is the Object of Discovery • Functional candidates • Many pathways offer exciting candidates • Ultimately a “Genetics of the Genes”
Positional Cloning:Top-DownPhenotype-driven Pathway to Novel Candidate Genes • Mapping reduces the complexity >100 fold • Primary mapping • Secondary mapping by association with variants identified in affected sample sets • Functional candidates within mapped region • Functional candidates • Many pathways now offer exciting candidates • Ultimately a “Genetics of Genes”
Next Generation Positional Cloning:Gene Mapping in Superfamilies • Central Problem: Most allele carriers for complex disease susceptibility alleles do not display phenotype • Low, moderate penetrance alleles need bigger window to ascertain families • Cannot extend families by following footprints of disease • Superfamilies provide bigger window, reveal footprints of low, moderate penetrance alleles • > 1,000 family members • Superfamilies display multiple aspects of phenotype • Expect, and are seeing, extensive overlap among cancers
50,000 Families, each founded by a pioneer couple Many kinships >1,000 Pedigrees recorded in computerized database SuperfamiliesUtah Population Databases Advantages • Reduces heterogeneity • Founder logic – one locus, one allele • Reveals dominant alleles with reduced penetrance
Superfamilies Provide Identity-By-Descent Mapping • One gene, one variant brought in by founding pioneer couple • Power for high resolution mapping • Pairwise testing shows IBD segment 10mb – 20mb
Co-Aggregation of Cancers in Superfamilies Co-aggregating Disease Odds ratios for SF at “high-risk” for Outcome Disease given that they are classified as “high-risk” for Co-aggregating Disease. If OR is significantly different from 1.0, number is in light mustard-biege.
Affected Individuals within Kinship Identical-by-Descent at Susceptibility Locus • Will see association through genome scan with STR markers
Conserved Chromosomal Segment Size 112.2 mb D5S1393 118.3 mb D5S1346 D5S2501 122.4 mb D5S2051 123.4 mb 124.3 mb D5S421 APC 124.8-125.1 mb D5S656 125.7 mb 126.7 mb D5S2065 APC 127.2 mb D5S659 D5S1720 127.5 mb D5S494 130.8 mb D5S639 131.0 mb ATA24E05 131.8 mb D5S592 132.7 mb D5S615 139.0 mb Chromosome 5 D5S1391 141.3 mb