Download
1 / 25
270 likes | 377 Vues
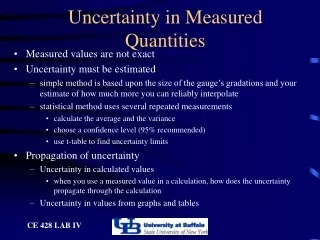
This study investigates the phonon spectrum of a one-dimensional Yukawa chain formed by polymer microspheres trapped in a dusty plasma. We experimentally observed the lowest-order sloshing and breathing modes and analyzed the elastic vibrations through video microscopy. Our method includes measuring the particle motion and calculating the current correlation function to derive the dispersion relation of the phonons. The experimental setup utilizes laser manipulation to excite vibrational modes in the microspheres, elucidating the unique characteristics of these soft colloidal structures under low-density plasma conditions.

E N D
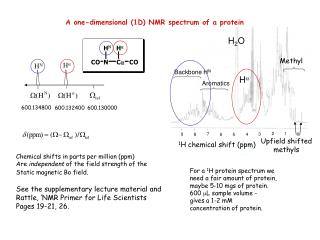
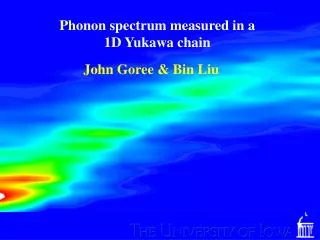
Phonon spectrum measured in a 1D Yukawa chain John Goree & Bin Liu
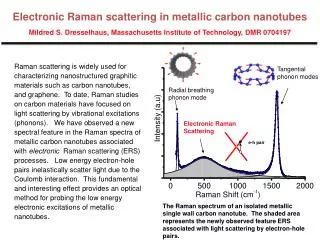
Modes in 1-D chains • Colloids: • Polymer microspheres trapped by counter-propagating laser beams • Lowest-order modes (sloshing & breathing modes) observed experimentally • Carbon nanotubes: • Xe atoms trapped on a tube • Theory: phonon spectrum Tatarkova, et al., PRL 2002 Cvitas and Siber, PRB 2003
Modes in a 1-D chain Longitudinal mode • Transverse mode
Experimental system: dusty plasma • Like a colloidal suspension: • polymer microspheres • electrically charged • suspended in medium that provides screening • colloidal crystals • optical methods include: • direct imaging of particles • laser manipulation
Experimental system: dusty plasma • The medium is a plasma: • a low-pressure gas • partially ionized by applying high voltage
Experimental system: dusty plasma What’s special about plasma: • Medium is low density: • gas instead of a solvent • microspheres are underdamped • Suspension is very soft: • shear modulus of a 3D crystal is ´1019 smaller,as compared to metals • Temperature can be varied: • not in this talk
Microspheres • Melamine formaldehyde • diameter 8.09 mm • introduced into plasma by shaking a dispenser
In this experiment: • charge Q - 7600 e • screeninglength lD 0.86 mm • spacing a 0.80 mm } >> particle radius 4 mm Pair potential Particles suspended as a monolayer interact with a repulsive Yukawa potential:
Suspension of Microspheres • Microspheres: • have no buoyancy • levitated by electric field a few mm above electrode substrate • form horizontal monolayer • no out-of-plane buckling is observed • ordered lattice QE mg electrode substrate
Setup: Ar laser beam 1
Microspheres are trapped above the groove resonant frequency 0.1 Hz 3 Hz groove 15 Hz “Channel” on substrate to confine a chain Groove-shaped channel in lower electrode shapes the E field that confines particles
particle’s x,y position measured in each video frame Image of chain in experiment
incident laser beam momentum imparted to microsphere Vibrational Excitation • Elastic vibrations can be excited by: • Brownian motion in gas • Laser manipulation
1 mm Experiment:Natural motion of a 1-D chain (no manipulation) central portion of a 28-particle chain
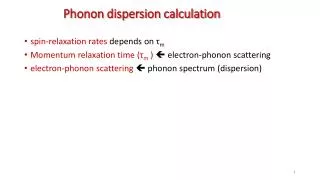
Measuring phonon spectrum • Method: • Video microscopy • Particle tracking Þx(t) & v(t): • Calculate current correlation function C(q,t) • Fourier transform ÞC(q,w)
Phonon spectrum Color corresponds to energy Energy is concentrated in a band that corresponds to a dispersion relation Symbols indicate peaks
Phonon spectrum Color corresponds to energy Energy is concentrated in a band that corresponds to a dispersion relation Symbols indicate peaks
modulated beam 1 mm -I0 ( 1 + sint ) continuous beam I0 Excitation with laser manipulation Net force µI0 sint Wave propagates to two ends of chain
longitudinal transverse N = 28 N = 28 ○ excited Ñ natural ○ excited Ñ natural Dispersion relation - natural & externally excited
Summary • We used direct imaging to observe particle motion in a 1-D chain • We characterized the phonons by: • Power spectra • Dispersion relation • More details & theory: • Liu, Avinash & Goree PRL 2003 • Liu & Goree PRE 2005
Modulating the laser power scanning mirror Ar laser beam
Argon laser beam Argon laser beam Experiment result • wave: • is excited in the middle of chain • propagates to two ends of chain
Thermal motion Gas temperature = room temperature Particle kinetic temperature was computed from particle velocities 230 K from mean kinetic energy: 390K from fit of velocity distribution function: