Intermolecular Forces
Intermolecular Forces. (rev. 12/15/09). Objectives. SWBAT: Distinguish between different types of intermolecular forces. Complete a heating or cooling curve calculation. Intermolecular Forces.

Intermolecular Forces
E N D
Presentation Transcript
Intermolecular Forces (rev. 12/15/09)
Objectives • SWBAT: • Distinguish between different types of intermolecular forces. • Complete a heating or cooling curve calculation.
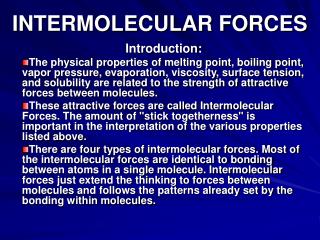
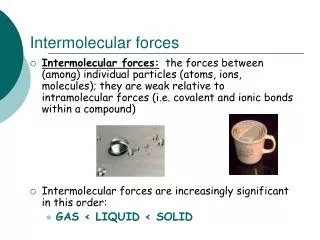
Intermolecular Forces • Forces that hold solids and liquids together may be ionic or covalent bonds or they may involve a weaker interaction called intermolecular forces. • All of these forces are van der Waals forces
Intermolecular Forces • Generally, the strengths of intermolecular forces are much weaker than intramolecular forces (ionic or covalent bonds). • The stronger the attractive force, the higher the boiling or melting points.
The Intermolecular Forces (forces between molecules) are weaker than Intramolecular Forces (The Chemical Bonds within an Individual Molecule).
Types of Intermolecular Attractive Forces • Ion – Dipole Forces • Dipole – Dipole Forces • Hydrogen Bonding • London Dispersion Forces
Dipoles arise from opposite but equal charges separated by a distance. Molecules that possess a dipole moment are called Polar molecules (remember the polar covalent bond?).
Ion-Dipole Forces • Ion-dipole forces – exist between an ion and the partial charge on the end of a polar molecule • http://www.chem.purdue.edu/gchelp/liquids/ions.gif
Electrolytes • When salt is dissolved in water, the ions of the salt dissociate from each other and associate with the dipole of the water molecules. This results in a solution called an Electrolyte.
Dipole – Dipole Forces • Dipole-dipole forces – exist between neutral polar molecules, when dipoles are close together • these are weaker than ion-dipole forces • The molecules orient themselves to maximize the positive/negative interactions and to minimize the + + and - - interactions. • These forces are typically only about 1% as strong as covalent or ionic bonds. • These forces rapidly become weaker as the distance between the dipoles increases.
Dipole-Dipole • http://upload.wikimedia.org/wikipedia/commons/5/59/Dipole-dipole-interaction-in-HCl-2D.png
http://itl.chem.ufl.edu/2041_f97/lectures/lec_g.html • Inductive forces arise from the distortion of the charge cloud induced by the presence of another molecule nearby. The distortion arises from the electric field produced by the charge distribution of the nearby molecule. • These forces are always attractive but are in general shorter ranged than electrostatic forces. If a charged molecule (ion) induces a dipole moment in a nearby neutral molecule, the two molecules will stick together, even though the neutral molecule was initially round and uncharged.
London Dispersion Forces • London Dispersion forces: exist primarily between non-polaratoms or molecules, (including noble gases) • Sometimes called induced dipole-induced dipole attraction. • These forces exist between all molecules to some degree.
http://itl.chem.ufl.edu/2041_f97/lectures/lec_g.html • Inductive forces that result not from permanent charge distributions but from fluctuations of charge are not called inductive forces at all but are called London Dispersion forces. • These forces are everywhere but are most important in systems that have no other types of molecular stickiness, like the rare gases (rare gases include the noble gases, xenon, krypton and neon). • The rare gases may be liquified, and it is dispersion forces that hold the atoms together (no electrostatic or inductive forces exits)
London Dispersion Forces • The constant motion of an electron in an atom or molecule can create an instantaneous dipole moment by affecting the electron distribution of a neighboring atom • This inter-atomic attraction is relatively weak and short lived. This is the weakest intermolecular force. • The strength of these forces increases with increasing molecular mass
London Dispersion Forces • London forces are the attractive forces that cause non-polar substances to condense to liquids and to freeze into solids when the temperature is lowered sufficiently. • Dispersion forces are present between any two molecules (even polar molecules) when they are almost touching (this means they are found in all substances).
London Dispersion Forces http://itl.chem.ufl.edu/2045/matter/FG11_005.GIF
London Dispersion Forces • Dispersion forces are present between all molecules, whether they are polar or nonpolar. • Larger and heavier atoms and molecules exhibit stronger dispersion forces than smaller and lighter ones (outer electrons are shielded from nucleus positive charge allowing more interactions). • In a larger atom or molecule, the valence electrons are, on average, farther from the nuclei than in a smaller atom or molecule. They are less tightly held and can more easily form temporary dipoles. • The ease with which the electron distribution around an atom or molecule can be distorted is called the polarizability.
London Dispersion Forces • London dispersion forces tend to be: • stronger between molecules that are easily polarized. • weaker between molecules that are not easily polarized.
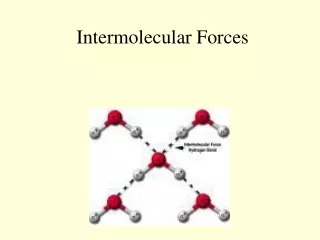
Hydrogen Bonding • Hydrogen bonding – is a special type of intermolecular attraction that exists between the hydrogen atom in a polar bond (particularly an H-F, H-O or H-N bond) and an unshared electron pair on a nearby small electronegative ion or atom (usually an F, O, or N atom on another molecule). • This is a specific type of dipole-dipole force
Hydrogen Bonding https://vinstan.wikispaces.com/file/view/800px-Hydrogen-bonding-in-water-2D.png/46631659/800px-Hydrogen-bonding-in-water-2D.png
Hydrogen Bonding • Two factors account for the strengths of these interactions: 1. large polarity of the bond 2. close approach of the dipoles (allowed by the very small size of the hydrogen atom)
Hydrogen Bonding • Each attraction is electrostatic in nature, (involving attractions between positive and negative species) • See Brown and LeMay page 403 for a flow diagram for intermolecular forces.
Polarizability • Polarizability – the ease with which the charge distribution in a molecule can be distorted by an external electric field. (see B&L pg. 397) • More polarizable molecules have stronger London Dispersion forces • Strength increases with increasing size occurs between all polar and non-polar molecules
Properties of Liquids • viscosity – the resistance of a liquid to flow • The greater a liquid’s viscosity, the more slowly it flows. • Viscosity decreases with increasing temperature. At higher temperatures, the greater average kinetic energy of the molecules more easily overcomes the attractive forces between molecules.
Surface Tension • Surface tension – the energy required to increase the surface area of a liquid by a unit amount. • Surface tension is due to an increase in the attractive forces between molecules at the surface of a liquid compared to the forces between molecules in the center, or bulk, of the liquid. This property causes fluids to minimize their surface areas. • see Brown and LeMay page 404
Surface Tension • When a liquid is poured onto a solid surface, it tends to bead as droplets, which is a phenomenon that depends on the intermolecular forces. http://quest.nasa.gov/space/teachers/microgravity/image/66.gif http://z.about.com/d/physics/1/G/8/0/-/-/SurfaceTension.png
Surface Tension • Although molecules in the interior of the liquid are completely surrounded by other molecules, those at the surface are subject to attractions only from the side and from below. The effect of this uneven pull on the surface molecules tends to draw them into the body of the liquid and causes a droplet of liquid to assume the shape that has a minimum surface area (a sphere).
Phase Changes Section Vocab • The melting process for a solid can be referred to as fusion. • A heating curve is a plot of the temperature versus the amount of heat added. • A cooling curve is a plot of the temperature versus the amount of heat removed. • Critical temperature is the highest temperature at which a substance can exist as a liquid. • The critical pressure is the pressure required to bring about liquefaction at this critical temperature.
Heating Curve of Water Heat of vaporization Heat of fusion (1) is ice(2) is ice and liquid water (melting)(3) is liquid water(4) is liquid water and vapor (vaporization)(5) is water vapor http://www.greatneck.k12.ny.us/GNPS/SHS/dept/science/Blumberg/worksheets/heating%20curve%20and%20energy_files/image003.jpg
Heat of Fusion • Heat of Fusion (ΔHvap) is the energy required to melt one mole of a substance at constant temperature.
Heat of Vaporization • Heat of vaporization (ΔHvap) is the energy required to vaporize one mole of a substance at constant temperature.
Lines on the Graph • The horizontal lines of a heating curve represent the heat of fusion and heat of vaporization. • Notice that the temperature doesn’t change during melting or vaporization. • The nearly vertical lines represent the heat required to effect the corresponding temperature change of a single phase.
Heating Curve Diagramhttp://library.thinkquest.org/C006669/media/Chem/img/Graphs/HeatCool.gif
Heating Curve for Water • http://www.bbc.co.uk/schools/ks3bitesize/science/chemistry/physical_changes_4.shtml
Heating and Cooling Curves • We need to look in the textbook to see some heating and cooling curves and how to do the calculations. • See B&L page 406 • Try Sample Exercise 11.4 and the Practice Exercise
Students • See teacher’s webpage for several heating/cooling curve links • Try http://chapsipc.wetpaint.com/page/Calculating+Heating+Curve+of+Water?t=anon for an example heating curve calculation
Phase Diagrams • A phase diagram is a graphical way to summarize the conditions under which equilibria exist between the different states of matter. • The diagram also enables us to predict the phase of a substance that is stable at any given temperature and pressure. • See the diagrams B&L page 413
The point where the three lines intersect in a phase diagram shows the pressure and temperature where the solid, liquid, and vapor all exist in equlibrium. This point, which occurs for water at 0.01°C (32.02°F), is known as the triple point.http://encarta.msn.com/media_461541579/phase_diagram_for_water.html
http://www.chem.queensu.ca/people/faculty/Mombourquette/FirstYrChem/colligative/index.htmhttp://www.chem.queensu.ca/people/faculty/Mombourquette/FirstYrChem/colligative/index.htm
On a Phase DiagramYou should be able to label: • Each phase change (i.e. sublimation, melting, freezing, etc.) • Triple point and critical point. • Direction of curves for H2O and CO2 diagrams.
Triple Point • The “triple point” is where all three curves intersect on a phase diagram. • All three phases co-exist at this point.
What is the definition of the term “critical point” on a phase diagram?
Phase Diagrams • Each diagram contains 3 curves. • Each curve represents conditions of temperature and pressure at which the various phases can coexist at equilibrium.
General Phase Diagramhttp://images.google.com/imgres?imgurl=http://kramerslab.tn.tudelft.nl/~rob/Courses/PhysicsOfFluids/Figures%2Bmovies/PhaseDiagram.jpg&imgrefurl=http://kramerslab.tn.tudelft.nl/~rob/Courses/PhysicsOfFluids/html-lectures/Lecture1.1.html&usg=__kgqG_EuLDs-byFSuKYNB_JM-HTQ=&h=315&w=412&sz=19&hl=en&start=5&tbnid=vuK0Mfhoi9N4aM:&tbnh=96&tbnw=125&prev=/images%3Fq%3Dphase%2Bdiagram%26gbv%3D2%26hl%3Den
Phase Diagram • On the previous slide see the liquid/gas curve. • This is the vapor pressure curve. • The point on the graph where the vapor pressure is 1 atm is the normal boiling point of the substance. • The vapor pressure curve ends at the critical point. • Beyond the critical point the liquid and gas phases becomes indistinguishable.
Phase Diagram for Carbon Dioxidehttp://serc.carleton.edu/images/research_education/equilibria/h2o_phase_diagram_-_color.v2.jpg
Notice the solid/liquid curve on the carbon dioxide phase diagram. • This curve follows the typical behavior, the melting point increases with increasing pressure.