Download

1 / 25
250 likes | 394 Vues
WA ST Dept. of Ecology Dam Safety Office Draft Seismic Practice. Jerald LaVassar 1 , Lead Engineer July 2012. 1 jlsd461@ecy.wa.gov. Pend Oreille Mines Tailings Facility. Asamera. City of Marysville Stormwater Pond. Portfolio Mentality Required.

E N D
WA ST Dept. of EcologyDam Safety OfficeDraft Seismic Practice Jerald LaVassar1, Lead Engineer July 2012 1jlsd461@ecy.wa.gov
Pend Oreille Mines Tailings Facility Asamera City of Marysville Stormwater Pond Portfolio Mentality Required
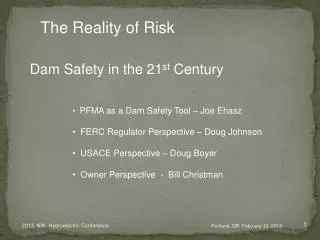
WA’s Consequence Dependent Risk Based Design Approach Identifying a suitable minimum design performance goal
Worksheet to Quantify RiskSelection of Design/Performance Goals for Critical Project Elements, Appendix A, Technical Note 2 Controlling factor typically
Design Performance Goal Where there is the potential for loss of life – design is at a minimum of Step 3
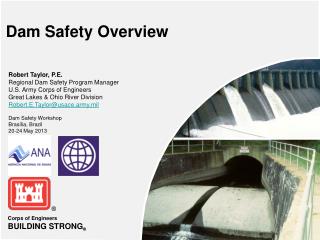
Associating ground motions with design performance goal at a specific dam
0.1 USGS event of interest is not generally representative of DSOevent of interest. Total mean hazard WUS Crustal hazard Deep Intraplate hazard Cascadia Megathrust hazard 0.01 USGS is interested in predicting IMs at a given exceedance probability USGS PSHA The DSO is interested in predicting the annual probability of a dam failing. To do that we need the individual hazard curves for the various contributing source zones. 0.001 Annual Exceedance Probability Dam Safety Office 0.0001 Total Mean Hazard vs. Individual Source Zone Hazard Curves 0.00001 0.2 0.4 1.0 second Spectral Acceleration (g)
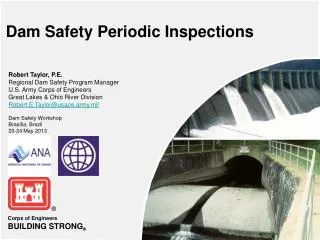
0.1 Cascadia Megathrust Scenario Total mean hazard SA - g WUS Crustal Accel - g Deep Intraplate CascadiaMegathrust Time - sec 0.01 Period – sec -> Function of Individual Source Mean Mw, R, & Epsilon and θ USGS PSHA 0.001 WUS Crustal Scenario Annual Exceedance Probability Dam Safety Office Accel - g SA - g 0.0001 Time - sec Period – sec -> 0.00001 0.2 0.4 Idealized Process to Generate Suites of Ground Motion Time Histories 1.0 second Spectral Acceleration (g)
Dam Safety Office practice in conducting our independent seismic analyses
Minckler Dam Project Locale
Minckler Dam 1) Model problem geometry (LIDAR data & surveyed dam cross-section) 2) Chose a constitutive model (effective stress model tracks seismic induced pore pressure changes) 3) Select suite of EQ time histories representative of principal source zones contributing to the seismic hazard at a consistent exceedance level
All distances in feet Line 2000 390 Line 3000 Upper Pond Less dense fill N1,60 ~ 13.5 380 VS m/sec 190 12 ? 210 VS m/sec 14.5 230 190 17.5 370 9 250 More dense fill N1,60 ~ 20 175 20 12 190 270 15 210 25 Lower Pond 17 230 20 >300 Unweathered Till N1,60 > >50 250 22.5 270 27 290 ? 29 >300 0 Weathered Till N1,60 > 50 50 90 Note: Line 3000 was run along the downstream face. Raleigh wave solutions assume the ground surface is level so that the wave direction is in a vertical plane and that the vertical plane coincides with a principal stress plane. This is not the case for Line 3000 and thus, the shear wave velocities (VS) are more suspect. I have assumed that the level of compaction would be less near the dam slopes where there is less horizontal confining stress to assist in the compaction process and operators would have been reluctant to get too near the edge for fear of rolling the hauling equipment. Minckler Dam B Cross-section JML 12/21/2010
Note: Assumed engineered fill has same properties as Fill between 12 to 16 feet in Table 1 of Model Soil Properties. Wide drain at interface of old dam section with buttress not shown. Assume similar properties for both buttress fill and that of drain. Upper Pond 20 ft 11 ft Drained buttress 84 ft 82 ft 2 1 1.9 1 70 ft Lower Pond Existing dam 58 ft 24 ft Filter/Drained Buttress JML 3/2011
Input earthquake record: 2001 Nisqually at DNR building in g. The record was scaled to PGA 0.58g and only the first 30 sec was run in the dynamic analysis.
Vertical displacement after buttress addition. zdis maximum was reduced from 1.3 ft to 0.4 ft along central reach of the dam crest.
Minckler Dam High Downstream Hazard Setting Case where multiple source zones contribute in roughly equal fractions to the hazard and thus, the recurrence intervals for each of the larger single source zone hazard curves would be significantly larger than the return period for the Intensity Measure cited in the PSHA.
Total Mean Hazard 1% chance of exceedance in 50 years - SA0.5 sec 1.04 g Mean Spectral Acceleration at 0.5 second period @ 1% chance of exceedance in 50 years Cascade Interface Composite -- 0.57 g PNW Deep Gridded -- 0.61 g Strawberry Pt. -- 0.40 g Devil’s Mtn. Fault -------- g
Total Mean Hazard 1% chance of exceedance in 50 years - SA0.5 sec 0.90 g Mean Hazard Pacific Deep Gridded Source Zone GMPE Weights Zhao 50% 67% 50% A & B 50% 33% 25% Youngs 0 0 25% Mw 6.99 6.97 6.78 R (km) 63.5 63.7 69.8 ε 1.36 1.39 1.64 SA 0.5 sec(g) 0.40 0.39 0.56 Not USGS 2008 Deagg! – Case where Young et al. 1997 attenuation relationship given zero weight
Strategy Purchase 3 month/25 site license for EZ-Frisk once BC Hydro & Zhao GMPEs are updated and we can get our hands on them Setup & run USGS analysis to demonstrate it yields USGS results Rerun analysis for a single source zone to yield SA hazard curve Select SA value at desired exceedance probability for that single source and deaggregate to obtain largest R/M/ε bin contributor Compile uniform hazard spectra/conditional mean spectra from GMPEs Select suite of time histories to cover the spectra and run model If dam survives, move on to next source zone and repeat above If dam fails, find minimum SA/time histories necessary to fail the dam. Determine the exceedance probability for that scenario.
Anxiously awaiting Processed subduction zone time histories appropriate for PNW use Attenuation relationships (GMPE) that reflect the dramatic increase in record numbers and at greater magnitudes in both the Maule & Tohoku Earthquakes A study of how actual dams performed in the above mentioned earthquakes/verses how our engineering methods would have predicted them to have performed.