1 / 0

Poverty and Affluence in Canada

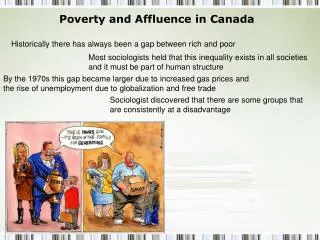
Poverty and Affluence in Canada. http://www.youtube.com/watch?v=vN2WzQzxuoA. VS. $ 27, 097 $315, 462 $18 , 962 69 % of Canada’s $ $60 % of minimum wage earners in Canada 9.6 % of Canadians Ranked 9 th OECD Organization for Economic Cooperation &

sakina
Télécharger la présentation

Poverty and Affluence in Canada

An Image/Link below is provided (as is) to download presentation Download Policy: Content on the Website is provided to you AS IS for your information and personal use and may not be sold / licensed / shared on other websites without getting consent from its author. Content is provided to you AS IS for your information and personal use only. Download presentation by click this link. While downloading, if for some reason you are not able to download a presentation, the publisher may have deleted the file from their server. During download, if you can't get a presentation, the file might be deleted by the publisher.

E N D

Presentation Transcript


  1. Poverty and Affluencein Canada

    http://www.youtube.com/watch?v=vN2WzQzxuoA VS.
  2. $27, 097 $315, 462 $18, 962 69% of Canada’s $ $60% of minimum wage earners in Canada 9.6% of Canadians Ranked 9th OECD Organization for Economic Cooperation & Development places Canada compared to the World RE: Social Justice Women Richest 20% Canadians Prime Minister of Canada salary 2011 Median income for Canadians in 2006 Median income for Aboriginal Canadians in 2006 Live in poverty
  3.  $315, 462  $27, 097  $18, 962  69% of Canada’s $  60% of minimum wage earners in Canada  9.6% of Canadian  Ranked 9th OECD Organization for Economic Cooperation & Development places Canada compared to the World RE: Social Justice  Women  Richest 20% Canadians  Prime Minister of Canada salary 2011  Median income for Canadians in 2006  Median income for Aboriginal Canadians in 2006  Live in poverty
  4. AFFLUENCE “The state of having much wealth or property” Canada is recognized as a prosperous and affluent country based on the following: Highly developed social welfare system that includes universal health-care Strong human rights policies Generous social benefits Education is mandatory through age 15 literacy rate exceeds 97 percent. highest 10 % of the population accounts for 23.8 % of all income At the same time, the lowest 10 % makes only 2.8 %t of all income The majority of Canadians make up the middle class. Thus, while most Canadians may enjoy the nation’s prosperity, several groups continue to be excluded: Native people, immigrants, women and the disabled. http://www.nationsencyclopedia.com/economies/Americas/Canada-POVERTY-ANDWEALTH.html#ixzz1T3Fxc7Ai(source)
  5. Affluence E-Trade Commercials: An example of Affluence Make some assumptions on the financial status of this family based on what you observe in these commercials as well as identifying the target audience. http://www.youtube.com/watch?v=Fmw23Ad9aLM&NR=1
  6. Address the following questions based on the commercials you watched: Can every Canadian family relate to this commercial? Does it exclude some people? How accurate do you think it is of the average Canadian family? How accurately does it reflect your family? List some barriers that may exist for some families and individuals to access such things. What are the consequences of unequal access to such amenities?
  7. Why Go to University?http://www.globecampus.ca/in-the-news/globecampusreport/why-go-to-university/ Read the article and be prepared to answer the following question for discussion: Do you think post-secondary education (at least three years) should be provided free to Canadian students? What would be the reasons to support this idea? What would be the reasons to oppose it? Do you think it is feasible and would you recommend this to the government – why or why not? Check this case study out – comparison of university institution in Canada vs. Ireland http://www.youtube.com/watch?v=mrLScPk8HsQ
  8. Do you think post-secondary education (at least three years) should be provided free to Canadian students? What would be the reasons to support this idea? What would be the reasons to oppose it? Do you think it is feasible and would you recommend this to the government – why or why not?
  9. Poverty and Affluence in a Developing Country – US Case Study

  10. Gap Between Rich and Poor is Getting Bigger http://www.globalresearch.ca/gap-between-rich-and-poor-is-widening-the-us-poverty-report-and-obamas-economic-recovery/5304865 Gap Between Rich and Poor is Widening: The US Poverty Report and Obama’s “Economic Recovery” By Andre Damon and Barry Grey Global Research, September 16, 2012 World Socialist Web Site
  11. The report revealed that the ranks of those classified by the government as poor remained at record highs in 2011, while the gap between rich and poor widened further. Some 46.2 million people remained below the official poverty line in 2011, the highest number in more than half a century. The 15.0 percent poverty rate, essentially unchanged from 2010, was the highest since 1983. The impact of poverty is particularly devastating for the young. One in five American children was poor in 2011. The poverty rate of young adults age 25-34 living with their parents, based on their own income alone, was 43.7 percent. All of these figures grossly underestimate the real level of poverty, since the government’s poverty threshold, set at an annual income of $23,021 for a family of four, is absurdly low. A major factor in the further fall in household income was a decline in wages. Average weekly wages for non-supervisory workers fell 0.3 percent after adjusting for inflation. The impact of the nationwide campaign of wage-cutting was reflected most clearly in a 17.3 percent jump in the number of workers in the lowest income group holding down full-time jobs.
  12. The combined share of income declined for the middle and fourth quintiles of US households. It increased 1.6 percent for the highest quintile, and within that quintile, the share of aggregate income for the top 5 percent increased 4.9 percent. The top 1 percent of earners saw a 6 percent rise in income. The second and third quintile of Americans now account for only 23.8 percent of the nation’s income, the lowest since the 1960s.
  13. Gap Between Rich and Poor is Getting Bigger http://www.globalresearch.ca/working-poor-report-nearly-30-percent-of-us-families-subsist-on-poverty-wages/14715 “Working Poor” report: Nearly 30 percent of US families subsist on poverty wages. By Tom Eley Global Research, August 10, 2009 wsws.org 30 October 2008
  14. A report released in October 2008 by the Working Poor Families Project reveals that more than 28 percent of American families with one or both parents employed are living in poverty. The report, “Still Working Hard, Still Falling Short,” is based on data for the period from 2004 through 2006 gathered from the US Bureau of Labor Statistics, the US Census Bureau’s American Community Survey and the Census Bureau’s Current Population Survey. The report finds that 9.6 million households can be described as low-income or “working poor”—defined as families that earn less than 200 percent of the official poverty level. There were 350,000 more such families in 2006 than in 2002. More than 21 million children now live in low-income working families—an increase of 800,000 in four years. In 2006 there were more than 29 million jobs in the US that paid below the official poverty level—defined as $9.91 an hour for full-time labor—an increase of nearly 5 million poverty-wage jobs from 2002. Family income inequality also increased rapidly between 2002 and 2006, the report says. In 2006, the top 20 percent of US households earned on average 9.2 times as much as the bottom quintile. The report notes that working poor families “lack the earnings necessary to meet their basic needs—a struggle exacerbated by soaring prices for food, gas, health and education.” About 60 percent of low-income working families are forced to spend more than one-third of their income on housing, and nearly 40 percent lack health insurance for one or both parents. These families struggle under poverty conditions despite parents working long hours. According to the report, “Adults in low-income working families worked on average 2,552 hours per year in 2006, the equivalent of almost one-and-a-quarter full-time workers.”
  15. http://www.cbsnews.com/video/watch/?id=7358670n Hard times generation: homeless kids March 6, 2011 For some children, socializing and learning are being cruelly complicated by homelessness, as Scott Pelley reports from Florida, where school buses now stop at motels for children who've lost their homes.
  16. POVERTY Canada has no “official” definition of poverty. Instead, there are several different agencies and organizations that measure the rate and levels of poverty. The most common tool used to determine poverty in Canada is the Low Income Cut-Off Line (LICO) provided by Statistics Canada. In 2005, 10.8% of all Canadians had after-tax incomes lower than the LICO; that accounts for more than 3.4 million Canadians Poverty does not mean homelessness It is a lack of access to sustainable living It means not having unlimited access to food, shelter, clothing, heat, etc. It also means not having access to proper healthcare, dental care, minimum wage and benefits www.cpj.ca/en/content/poverty-canada(source)
  17. Absolute vs. Relative Poverty Absolute Poverty - a lack of basic necessities for survival (e.g. Starvation) Relative Poverty - survival, but far below the general living standards of the society or social group in which they are living
  18. Economic Inequality - Large differences in income and wealth between individuals and groups; differences in the economic power of nations Poverty is not merely poor living conditions, it is also a cause of social isolation, illness and mental unease Income and resources are unequally distributed among groups in our society – social classes.
  19. Poverty in CanadaIncome Inequality in Canada In Canada from the 1920’s to the 1970’s poverty was regarded as a characteristic of society that they should try to understand not eliminate Most basic way to understand income inequality is to examine total family income by quintiles
  20. Measuring Poverty Using Quintiles Each quintile contains the same number (20%) of families Families in the highest quintile have family incomes that are significantly higher than families in the lowest.
  21. Comparing Absolute and Relative Incomes The statistics in the percentage graph show Relative Income Inequality comparing the % of total income of each quintile Absolute Income Inequality amount of money earned by different groups in Canada
  22. Poverty in CanadaIncome Inequality in Canada – Absolute Incomes ($)
  23. Poverty in CanadaIncome Inequality in Canada – Relative Incomes (%)
  24. Measures of Poverty Statistics Canada determines every year what it calls the (LICO) Low Income Cut Off Line aka poverty line
  25. Market Basket Measure (MBM) An imaginary “basket” of goods and services needed to survive at a minimum standard. Included in this basket is; A nutritious diet Clothing and footwear Rental unit (based on the median price in each community) Transportation (public transit when available) Other necessary goods and services (eg. Diapers, school fees, etc.)
  26. Social Support - Ontario Works If you are in temporary financial need, Ontario Works can: provide you with money, and help you find a job. To be eligible to receive help from Ontario Works, you must: live in Ontario need money right away to help pay for food and housing costs, and be willing to take part in activities that will help you find a job. http://www.mcss.gov.on.ca/en/mcss/programs/social/ow/index.aspx
  27. The table below compares Ontario Works (OW) shelter allowances the Ontario Disability Support Program (ODSP) shelter allowances, and minimum wage salaries for various household types. All three sources of incomes did not provide enough money to pay the average rent for an appropriate unit.
  28. Comparing LICO Data The LICO is the low income cut-off below which a family will likely devote a larger share of its income to the necessities of food, shelter and clothing than the average family. Working full time at minimum wage, an individual can earn $19,760/year before taxes
  29. Income Inequality and Poverty – LICO and Wage Rates – Wage Gap and Cycle of Poverty Question: What is the change in values for the LICO cut-offs from 1992, 2000 and 2010 for a family of 4 living in a city with a population between 100, 000 and 499,999? Question: An individual can earn $19,760/year before taxes working full time at minimum wage in 2010. What is the problem with this figure and the LICO figure for an individual (1 person) and the LICO cut-off in 2010 for that person living in a city with a population between 100, 000 and 499,999? Question: What does this tell us about the cycle of poverty and the wage gap?
  30. Generational and Situational Poverty Generational means a person has been that way for two generations or more. Situational poverty is when there is a death, a divorce, or an illness, and resources are temporarily reduced. Example: college days, or the first few years of teaching.
  31. Social Stratification – Development of Social Classes

  32. Social Stratification Most societies have systems of social stratification Social stratification is a system of inequality that ranks people on a hierarchy These could be based on race, class, gender, ethnicity, age, religion and so on Stratified societies are not equitable – people’s experiences and opportunities are defined by the social categories they belong to
  33. Social Stratification Systems Closed systems Boundaries are rigid, very little change to social position – people have set or ascribed status Examples caste system in India or slavery Open systems More flexible and people may move based on achieved status Social mobility (movement) can occur either inter or intra generationally – inter meaning by family members of the next generation or intra - in ones own lifetime Example class system in Canada (DeCoeur, Rawes & Warecki, 2012) ~
  34. Slavery Originated with the onset of the agricultural era Specialization of tasks increases divisions and inequalities between labourersand employees People were or are enslaved… to pay off debts, as punishment for a crime, as prisoners of war, born into slavery, or stolen during the slave trade During the Atlantic slave trade, Africans were captured and sold to European traders and then shipped to North and South America – forced to labour in mines, on plantations, in rice and sugar fields or as house servants. Became based on race with black people being subservient to whites. Slavery ends in the US in 1865 but the legacy continues to impact relationships between whites and blacks in North America
  35. History of Slavery - http://www.youtube.com/watch?v=zY-5Hq2B4rM
  36. Modern Day Slavery Slavery exists today, known as human trafficking, bonded labour, or sex trafficking and it is present world wide with an estimated 12 to 27 million people affected despite laws prohibiting it Nearly ¾ of these are women and ½ are children Most are poverty stricken and mislead; some are kidnapped In a global economy based on trade, even people are considered a commodity for sale Global Human Trafficking - http://www.ted.com/talks/sunitha_krishnan_tedindia.html Human Trafficking in Kitchener- Waterloo-Cambridge Region: http://metronews.ca/news/kitchener/381176/human-traffickers-operating-in-waterloo-region-group-warns/ http://www.therecord.com/news/article/743750--highway-401-a-magnet-for-human-trafficking-police-say
  37. Caste System This closed system is based on stratification that a person is born into Stratifications affect a person’s work, marriage, social life, and belief systems Caste systems exist(ed) in India and South Africa (Apartheid- racial segregation practiced in South Africa), and while both of these are working on breaking these systems, they still impact these cultures and people People are generally required to marry within their caste People are often segregated in different neighbourhoodsbased on caste – contact with a lower caste could pollute you
  38. Caste System in India http://www.youtube.com/watch?v=CTC51EZbtf8 http://www.youtube.com/watch?v=01cG6NXf2ZI
  39. Class System In a class system the stratification is based on ownership and control of resources and type of work a person does Boundaries are more vaguely defined People can move up or down based on education, skills and achievements Horizontal mobility is when you get a promotion or demotion but it essentially doesn’t change what class you are in Vertical mobility is when people you move up or down the class structure (DeCoeur, Rawes & Warecki, 2012)
  40. Social Class There are four general social classes – groups divided into wealth and resources - in Canada: The Upper Class 3 to 5% of Canadians Wealth is inherited Children go to private schools Exercise great power in business and government positions Upper-Upper Class One percent belongs to an upper-upper class distinguished primarily by "old money.” Lower-Upper Class The remaining 2-4% fall into the lower-upper class and depend more on earnings than inherited wealth. They are, for the most part, the "nouveau riche."
  41. Social class The Middle Class 40-50% of the Canadian population Because of its size it has tremendous influence on patterns of North American culture Considerable racial and ethnic diversity in this class The top half of this category is termed the "upper-middle" class with family incomes of $50,000 to $100,000 earned from upper managerial or professional fields The rest of the middle class (average middles) typically work in less prestigious white-collar occupations or highly skilled blue-collar jobs
  42. Social Class The Working Class This class comprises about one-third of the population and has lower incomes than the middle-class and virtually no accumulated wealth. Their jobs provide less personal satisfaction.
  43. Poverty in Canada The Working Poor News Report – http://swo.ctv.ca/servlet/an/local/CTVNews/20110401/poverty-protest-kitchener-110401/20110401/?hub=SWOHome
  44. Social Class The Lower Class The remaining 20% of our population is identified as the lower class. In 2001 roughly 15% of the Canadian population were labeled as poor. Many are supported entirely by welfare payments while others are among the "working poor" whose incomes are insufficient to cover necessities like food, shelter, and clothing. They typically live in less desirable neighbourhoods — often racially or ethnically distinct — and their children are often resigned to living the same hopeless lives of their parents. Recent government cut-backs on welfare in some provinces may lead to even greater living constraints for this group of people.
  45. Poverty and Economic Inequality: Social Problems and Causes of Poverty Many major social problems are a result of economic inequality – what do you think they are? Examples: Illiteracy Poor education Lack of basic necessities Homelessness Mental Stress and Illness Crime – Violence Addictions – Substance Abuse Isolation Environmental Issues
  46. Poverty and Affluence – Theory Application

  47. Marx & Weber - Conflict Theory Conflict Theory holds that inequality is bad, avoidable and unnecessary A struggle for resources or a share of the pie causes conflict between social groups Marx… Capitalism is an economic system which favoursthe rich class who exploit the poor class Weber…In addition to class – he adds status and power to the mix and essentially states that class, status and power create inequalities Class refers to money Status refers to prestige or lifestyle (level of education) Some jobs are highly revered but not necessarily highly paid such as firefighters or nurses Power refers to the ability to exercise one’s will over others
  48. How the Conflict Theory Can Apply to Poverty vs. Affluence in Crime It is not clear that poverty truly is the main contributor to crime rates. However, one might make the following argument to say that most crimes are, at least to some extent, caused by poverty. One could argue, for example, that poverty puts a great deal of stress on people. They often lack material things that they need or want. They might also feel the pressure of being poor in a society that values material possessions and wealth. Both of these might lead to crime. The desire for material goods might well lead to property crimes. People might steal in order to get money to buy the things they want or need. Or they might simply steal those things directly. The pressure of feeling like a failure might also lead to crime. It might lead to drinking or drug use, both of which might lead to violent crime. It might lead to feelings of anger which might manifest themselves in the abuse of family members. It might also lead people to join gangs in an attempt to feel valued. None of this is to say that poverty directly causes crime. However, it is likely that these kinds of pressures make the poor more likely to commit crimes.
  49. Functionalist Theory Inequality is inevitable, necessary & even positive We are all part of a bigger picture and we all play a role in it All societies have important tasks that must be accomplished Some positions are more important than others for our survival and should be filled by the most qualified people The most talented, trained individuals should be the most rewarded The most highly rewarded positions should be those many rely on for expertise So essentially in order to make sure society functions and all needs are met, it is important to reward people appropriately to keep the whole thing running smoothly
  50. Symbolic Interactionist Theory People make their own interpretations or meanings based on their experiences and interactions with others We understand things based on what our interactions have taught us (process of socialization where we come to understand what is expected of us so that we will succeed) People are socialized to accept a stratified structured society and see power as something that is relative and can be negotiated between different people They understand that they are part of a system and accept their role or expectations that others have for or from them
More Related