Quantitative Structure Activity Relationship (QSAR)
Quantitative Structure Activity Relationship (QSAR). Advanced Medicinal Chemistry ( Pharm 5219): Section A. Ref.: An Introduction to Medicinal Chemistry , 3 rd ed. 2005, G.L.Patrick , Oxford University press. Drug design: QSAR as a strategy.


Quantitative Structure Activity Relationship (QSAR)
E N D
Presentation Transcript
Quantitative Structure Activity Relationship (QSAR) Advanced Medicinal Chemistry (Pharm5219): Section A Ref.: An Introduction to Medicinal Chemistry, 3rd ed. 2005, G.L.Patrick, Oxford University press
Drug design: QSAR as a strategy Some – involve in a change in shape in order to have better fit for its target binding site. Others – involve in a change in functional group or substituent in order to improve pharmacokinetics or binding site interactions. These involve in synthesis of analogues with substituents on aromatic or heteroaromatic rings or accessible functional groups. Number of possible analogues could be infinite. So, a need of rational approach in deciding useful substituents. To tackle this problem, QSAR is extremely useful.
QSAR approach To identify and quantify physicochemical properties of a drug To see if any property has effect on drug’s biological activity. Then an equation is drawn up to quantify the relationship and the role of the property in pharmacokinetics & mechanism of action of drug. Also predict to calculate in advance the biological activity of a novel analogue.
Graphs & equations A range of compounds – synthesized Vary one physicochemical property (log P) and test biological activity (log 1/C) Plot biological activity on y-axis and physicochemical property on x-axis
Graphs & equations How to draw the best possible line? Done by ‘linear regression analysis by the least square method’ Draw arbitrary lines through points, draw vertical lines from each point Verticals – measure, square and add up to get a total (sum of squares) Best line is one where this total is minimum. Now, done using relevant software.
Graphs & equations How to see whether the relationship is meaningful? 1. by observing ‘goodness of fit’ Regression or correlation coefficient (r) tells how well the equation explains the variance in activity in terms of physicochemical parameters (usually quoted as r2) If r=1, a perfect fit (observed=calculated activity), impossible in reality If r>0.9 or r2>0.8, a good fit (acceptable) ‘r2 multiplied by 100’ indicates % variation in activity accounting for physicochemical parameters. For example, r2 = 0.85
Graphs & equations How to see whether the relationship is meaningful? 2. by calculating ‘standard error of estimate/standard deviation (s)’ Ideally s=0, if no experimental error in experiment or parameters. In reality, ‘s’ should be small. Necessary to know whether ‘s’ is acceptably low. Number of compounds (n) influences value of ‘s’.
Graphs & equations How to see whether the relationship is meaningful? 3. by using statistical tests e.g., Fisher’s F-test y = k1x + k2 To assess significance of coefficients for each parameter Normally, p values (obtained from F-test) 0.05 (to be significant) If not, the parameter – excluded from QSAR equation.
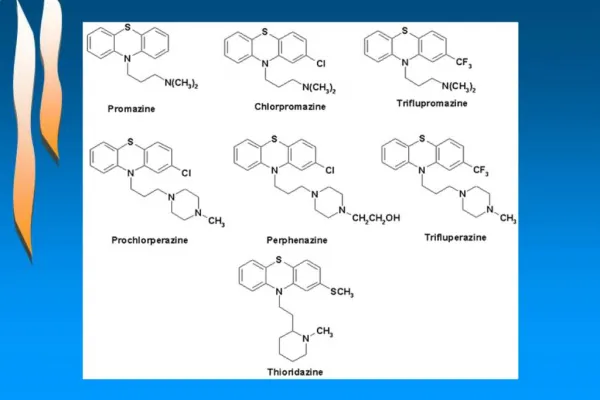
Physicochemical properties QSAR approach: many physical, structural and chemical properties Most common – hydrophobic, electronic & steric properties (as possible to quantify). QSAR studies – carried out on compounds of same general structure with varied substituents on aromatic rings or functional groups. Consider how the hydrophobic, electronic and stericproperties of substituentsaffect biological activity.
Hydrophobicity Crucial to how easily a drug crosses cell membrane and also, in receptor interactions. Hydrophobicity character of a drug – measured experimentally by testing relative distribution in oil-water mixture. Hydrophobic molecules dissolve preferably in oily layer. Hydrophilic molecules dissolve preferably in aqueous layer. Relative distribution is known as partition coefficient (p), p = Conc. Of drug in oily phase Conc. Of drug in aqueous phase
Hydrophobicity Hydrophobic compounds – high p value Hydrophilic compounds – low p value Varying substituentson lead compounds produce series of analogues with different hydrophobicity & different p values. Plot p values vs biological activity of these analogues, see if there is any relationship between these 2 properties. Biological activity is expressed as 1/C, where C is conc. of drug required to achieve a level of activity. More active drugs achieve a biological activity at lower concentration.
Hydrophobicity A straight line would be obtained with the equation: An example: Binding of drugs to serum albumin is determined by hydrophobocity. A study of 42 compounds resulted in the following equation: (n=42, r=0.96, s=0.159) Serum albumin binding increases as log p increases. Hydrophobic drugs bind more strongly to s. albumin than hydrophilic drugs
Hydrophobicity By knowing strength of binding with s. albumin, estimate effective dose for that drug. When serum albumin bound, drug cannot bind to receptor & so, dose level depends on unbound (free) drug in circulation. The equation helps to calculate binding strength of drugs of similar structure to s. albumin. Also, an indication of availability of free drugs to interact receptors. r=0.96 (close to 1), the line is a good fit. r2 = 92%, i.e., 8% variation due to experimental error & 92% due to difference in hydrophobicity of tested drugs.
Hydrophobicity However, increasing hydrophobicityincreases biological activity in other ways. Drugs – cross hydrophobic barriers (e.g., cell membranes) to reach their targets. - interact with a target (e.g., enzyme or receptor) (hydrophobic) Therefore, increasing hydrophobocity helps in crossing hydrophobic barriers and in binding to target sites.
Hydrophobicity • However, • Increasing log pshould not increase biological activity ad infinitum • Reasons……. • Drug may become poorly soluble in aqueous phase • Drugs may be trapped in fat deposits and never reach to site of action • Hydrophobic drugs are more susceptible to metabolism and elimination
Hydrophobicity • normally, • A straight-line relationship between log p and biological activity • Because,the range of log p values are relatively narrow. • In previous serum albumin binding example……. • Log p values in the range of 0.78 to 3.82 • If extended to include very high log p values, parabolic curve.
Hydrophobicity Parabolic curve can be expressed by the equation: • (log p)2 has a minus sign • If P is small, (log p)2 is very small & equation dominated by log p term, representing first part of the graph. • If P is large, (log p)2 is more significant & overwhelms log p term, representing last part of the graph where activity drops with increasing P. • k1, k2 & k3 are constants and determined by software program.
Hydrophobicity • Few drugs –related to log p only • Tend to operate in cell membrane (hydrophobicity is !!!!) • Example: general anesthesia • Function by entering CNS and dissolving into cell membrane • No specific drug-receptor interaction • Mechanism of action solely depends on ability to enter cell membrane (i.e., hydrophobicity)
Hydrophobicity General anesthetic activity of a range of ethers – fit the following parabolic equation: Anesthetic activity increases with increasing P. The relationship is parabolic and there is a log p0 beyond which increasing hydrophobicity decreases anesthetic activity. Possible to predict anesthetic activity of other compounds from their partition coefficients. But the equation is only for anesthetic ethers and not applicable to other structural types of anesthetics. (drawback of QSAR)
Hydrophobicity QSAR study of other structural types of general anesthetics – each case a parabolic curve. Although constants are different, optimum hydrophobicity (log p0) – close to 2.3. Suggesting that all general anesthetics – act in a similar fashion (also, depend on hydrophobicity of structure) log pvalue of any anesthetics gives an idea of potency. For example, p values of ether, chloroform & halothane are 0.98, 1.97 & 2.3; activity increases in same order.
Hydrophobicity General anesthetics – simple M/A based on efficiency to enter CNS So, log p value – indication of how easily a drug enters CNS Compounds having a log p value close to 2 enter CNS efficiently So, drugs targeted for CNS should have log p value close to 2 Accordingly, drugs targeted to act elsewhere should have log p value different from 2 (to avoid CNS side effects e.g., drowsiness)
Hydrophobicity To get P, synthesize compounds and Experimentally measure -(a lot of work and maximum would be in vain!!) Otherwise, calculate P theoretically and decide whether a compound is worth synthesizing (to target most promising-looking structure) Substituent hydrophobicity constant (π): - calculate contribution of various substituents to hydrophobicity. - a measure of how hydrophobic, a substituent is (w.r.t. hydrogen).
Hydrophobicity How to calculate π? P – measured experimentally for a standard compound (H) with & without a substituent (X). πX = Hydrophobicity constant for the substituent (X) PH = Partition coefficient for the standard compound PX = Partition coefficient for standard compound with substituent Positiveπ value – substituent more hydrophobic Negativeπ value – substituent less hydrophobic
Hydrophobicity An exercise: log p: benzene = 2.13, chlorobenzene = 2.84 & benzamide = 0.64; calculate theoretical log p for metachlorobenzamide. Benzene is the parent compound, Substituent constants for Cl and CONH2 are 0.71 and -1.49 respectively. Calculated log p is referred to as Clog p. The observed log p for metachlorobenzamide is 1.51.
Electronic effect Electronic effects of various substituents influence a drug’s ionization or polarity – affect how easily a drug passes through cell membrane or how strongly it interacts with binding site. For substituents on aromatic rings, Hammett substituent constant (σ): a measure of electron-withdrawing or electron-donating ability of substituents; determined by measuring dissociation of series of substituted benzoic acids and comparing with dissociation of benzoic acid itself.
Electronic effect Benzoic acid – a weak acid, partially ionizes in water. An equilibrium is set up between ionized and non-ionized forms. The relative proportions of these forms = equilibrium/dissociation constant, KH. If substituent is present, equilibrium is affected Electron-withdrawing groups (e.g., nitro group) shift equilibrium to ionized form with larger K value. Electron-donating groups (e.g., alkyl group) shift equilibrium to left with smaller K value (weaker acid).
Electronic effect Hammett substituent constant (σX) for a particular substituent (X) is defined by: (KH for benzoic acid) Electron-withdrawing substituents on benzoic acid – larger KX; so (+)veσX, e.g., Cl, CN, CF3, etc. Electron-donating substituents on benzoic acid – smaller KX; so (-)veσX, e.g., Me, Et, t-Bu, etc. σX for H is zero.
Electronic effect σX takes into account both resonance & inductive effects. So, σX depends on whether the substituent is meta or para. In meta position, electron-withdrawing is due to inductive effect. In para position, it is due to both inductive & resonance effects.
Electronic effect Most studies – consider σX & if more than 1 substituent, use ∑σ σ – a measure of substituent’s inductive & resonance effects With detailed studies, inductive (F) and resonance effect (R) – considered separately
Electronic effect Limitations to electronic constants: σ cannot be measured for ortho substituent very few drugs – activity is solely depended on electronic effect Constants (σ, R & F) – only useful for aromatic substituents.
Electronic effect Aliphatic electronic substituent constants: Obtained by measuring rates of hydrolysis for a series of ester Methyl ethanoate– parent ester; rate of hydrolysis varies with substituent X. Extent to which rate of hydrolysis is affected is a measure of substituent’s electronic effect at site of action. Electronic effect is purely inductive and denoted as σ1. Electron-donating group reduces the rate and has negative value of σ1. Electron-withdrwing group increases the rate and has negative value of σ1.
Steric factors Size & shape of a drug influence how easily it approaches and interacts with binding site. Bulky substituent acts like a shield and hinders interaction; alternatively, helps to orientate a drug properly for binding. More difficult to quantify steric properties than hydrophobic or electronic properties.
Steric factors 1. Taft’s steric factor (Es) – obtained by comparing rates of hydrolysis of substituted aliphatic esters with standard ester under acidic condition. Es = log kx – log k0 kx represents rate of hydrolysis of aliphatic ester bearing substituent X k0 represents rate of hydrolysis of reference ester. Substituents such as H and F (smaller than methyl group) – result in a faster rate of hydrolysis (kx>k0); so, (+)ve Es. Substituentslarger than methyl group – reduce the rate; so, (-)ve Es.
Steric factors 2. Molar refractivity (MR) - volume occupied by an atom or group of atoms n = index of refraction MW = molecular weight d = density • MR is particularly significant with substituents having π electrons or lone pair of electrons.
Steric factors 3. Verloopstericparameters - involves computer program called Sterimol - calculates steric substituent values from bond angles, van der Waals radii, bond lengths and possible conformation for substituent. - can be measured for any substituent For example, parameters for carboxylic acid group. (see figure 13.10 from book) L = length of substituent B1 - B4 = radii of group in different dimensions
Other physicochemical parameters Other properties – also considered - including dipole moments, hydrogen bonding, conformations, interatomic distance, etc. Quantifying these properties are difficult. Several formulae – developed based on highest occupied and/or lowest unoccupied orbitalsof test compounds. Calculation of these orbitals –carried out using semi-empirical quantum mechanical methods and also, indicative variables.
Hansch equation Biological activity of most drugs – related to combination of physical properties. Hansch equation – relate biological activity to most commonly used physicochemical properties (log p, π, σ, or a steric factor) If hydrophobicity values – limited to small range, linear equation: If hydrophobicity values – spread over a large range, parabolic equation:
Craig plot Tables of π & σ factors for different substituents are available. However, easier to visualize relative properties by considering a plot with y-axis for σ & x-axis for π which is called Craig plot. For example, Craig plot for para-aromatic substituents
Craig plot • Shows no relationship between σ & π. • Possible to tell at a glance which substituent has (+)ve or (-)veσ or π. • Easy to find substituent with similar σ or π value. • Used in planning which substituent to study in QSAR. • Hansch equation tells whether (+)ve or (-)veσ or π values are needed to get good biological activity, concentrate on the right quadrant on Craig plot.
Topliss scheme Sometimes, synthesis of large range of structure is difficult. So, few structures are synthesized, test them for biological activity and use these results to determine next analogues to be synthesized. A Topliss scheme is a flow diagram which allows such a procedure to be followed. 2 Topliss schemes: 1 for aromatic substituents, and 1 for aliphatic side chain substituents
Topliss scheme Topliss scheme for aromatic substituents
Topliss scheme Topliss scheme for aliphatic side chain substituents
Bioisosters Knowledge of substituent constants - to identify bioisosters. CN, NO2 & COMe have similar hydrophobic, electronic and steric factors and are potential bioisoters But groups can be bioisosters in some situations but not in others. For example,