Download
1 / 57
570 likes | 709 Vues
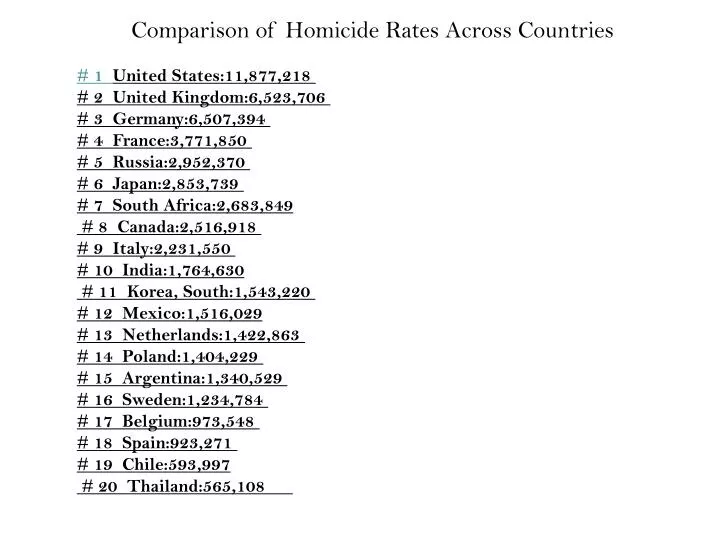
Comparison of Homicide Rates Across Countries. # 1 United States:11,877,218 # 2 United Kingdom:6,523,706 # 3 Germany:6,507,394 # 4 France:3,771,850 # 5 Russia:2,952,370 # 6 Japan:2,853,739 # 7 South Africa:2,683,849 # 8 Canada:2,516,918 # 9 Italy:2,231,550

E N D
Comparison of Homicide Rates Across Countries # 1 United States:11,877,218 # 2 United Kingdom:6,523,706 # 3 Germany:6,507,394 # 4 France:3,771,850 # 5 Russia:2,952,370 # 6 Japan:2,853,739 # 7 South Africa:2,683,849 # 8 Canada:2,516,918 # 9 Italy:2,231,550 # 10 India:1,764,630 # 11 Korea, South:1,543,220 # 12 Mexico:1,516,029 # 13 Netherlands:1,422,863 # 14 Poland:1,404,229 # 15 Argentina:1,340,529 # 16 Sweden:1,234,784 # 17 Belgium:973,548 # 18 Spain:923,271 # 19 Chile:593,997 # 20 Thailand:565,108
The Violent Crime Clock Although the rates of violent crimes in the United States have declined in recent years, they are still distressingly high, as these averaged statistics illustrate, and are much higher than they were several decades ago. (Based on Federal Bureau of Investigation statistics.) In the United States in 2002, there was, on average: One MURDER every 32 minutes One FORCIBLE RAPE every 6 minutes One AGGRIVATED ASSAULT every 35 seconds One VIOLENT CRIME every 22 seconds
Aggression/Violence --- Some Statistics • Overall, an estimated 1,417,745 violent crimes occurred in the U.S. in 2006
Aggression Laboratory Research Outline Longevity of Effects (short versus long-term) Over or under-estimates of real-life aggression • Violent Stimuli • Type (e.g., real, justified) • Amount (dose ) • Aggression Measures • Shock administration • Punching a doll Predisposed to aggress (e.g., previously angered or frustrated) Experimenter Demand Situational Factors Samples Grade school children Adults Gender
Aggression Field Research Consistency of results (significant on some measures but not others Magnitude of effects Arousal as a moderating variable Aggression Correlational Research Should the correlations between viewing violence and aggression increase with age Gender differences Bi-directional correlations (e.g., earlier viewing related to later aggression; later viewing related to earlier aggression aggression)
Comparison of the Effect of Violent Media on Aggression with Effects From Other Domains Smoking and lung cancer Media violence and aggression Condom use and sexually transmitted HIV Passive smoking and lung cancer at work Lead exposure and children’s IQ Nicotine patch and smoking cessation Calcium intake and bone mass Homework and academic achievement From Bushman, B.J., & Anderson, C. A. (2001). Media violence and the American public: Scientific facts versus media misinformation, American Psychologist, June/July, 477-489. Asbestos and laryngeal cancer Self-examination and breast cancer -.2 -.1 0 .1 .2 .3 .4
Children’s shows Prime-time shows 80 70 60 50 40 30 20 10 0 % of characters Violent characters Victims of violence Perpetrators or victims of violence
General Aggression Model Long-term effects occur due to the development of very accessible knowledge structures and emotional desensitization. Each violent media episode is a learning trial where rehearsal of aggressive thoughts and aggression-related emotions occur. These lead to chronically accessible hostile attitudes, beliefs, and scripts
Exposure to Violent Music Study 1 & 2 Procedure? Study 1 Findings: Violent song lead to significantly greater amounts of state hostility Study 2 Findings: Violent song produced higher similarity between aggressive and ambiguous word pairs. Violent song had much smaller contrast scores.
Study 3? Incorporating the role of arousal and trait hostility • No differences in arousal levels by song type • Trait hostility was related to state hostility • Those hearing a violent song had higher state hostility scores • Word pronunciation: Violent songs increased the accessibility of aggressive words
Study 4? Effects on aggressive thoughts and feelings of aggressive music (role of humor) • Significant main effect for trait hostility • No-song control group was similar to humorous violent song group • Humorous non-violent song group had much lower state hostility scores than the humorous violent song and control group • Violent and non-violent song groups were NOT significant (p < .07). Marginally significant?
Study 5? • The 2 violent song conditions had the highest state hostility scores; stronger for those who completed the hostility scale first • No effect for humorous content (p < .09) (Marginally significant?) • Significant role of trait hostility
~ Overall Issues~ • Role of arousal • Role of gender • Role of Trait Hostility (significant but does NOT moderate the relationship between violent stimuli and state hostility) • Type of music (e.g., violent, humorous) • Effects on: • State Hostility • Aggressive thoughts • Aggression-related thoughts, feelings • Short vs. Long-term impact Other Issues Interpersonal interactions Personality development Repeated exposure Priming effect
Media Violence and Aggression --- Longitudinal Study • Key Questions • To what extent does early childhood exposure to media violence predict young-adult • aggression and violence? • Are there gender differences in the predictability? • Does the extent to which the child viewer identifies with the aggressive character • or believes the plot is realistic affect the strength of the prediction? • To what extent does any long-term relation seem to be due to more aggressive • children simply liking to watch violence or seem to be due to some environmental, • family, or personal “third variable” that stimulates both childhood violence viewing • and childhood and adult aggression?
Critical Measures • Children: • Peer-nominations of aggression • TV-violence viewing • Identification with aggressive TV characters • Perceived realism of TV violence content Parent Measures Parenting Practices (self ratings) Rejection of child Aggressive personality Nurturance Severe physical aggression Harsh punishment Fantasizing about aggression Mobility orientation
Other Aggression Factors • Biology and genetics (identical twins studies, r = .30) • Physiology --- limbic system, hormones (testosterone) • Pain – discomfort (e.g., heat, frustration, stress) • Social learning --- modeling (e.g., media influence)
Temperature and Aggression (cont.) Violent Crime Ratio 40 35 30 25 20 15 40-57 69-72 78-80 85-88 93-95 Temperature (Fahrenheit)
Temperature and Aggression (cont.) .6 .5 .4 .3 HBP per game < 70 70-79 80-89 90 and above Temperature (Fahrenheit)
Association Between Violent Stimuli Homicide Rate • Sports (e.g., Boxing) • War • Modeling Explanation -- • Publicity Effect • Victim Similarity • (i.e., race of loser) • War and Homicide Rates --- Pre and Post war rates • Dose of war • Labeling Issue
Aggressive Cues and Violence TV Show Violent (swat team and use of walkie-talkie) Neutral Interview before hockey game Tape recorder Walkie-talkie Played in hockey game • Those who watched the violent TV show and were interviewed with a walkie-talkie (aggressive cue) behaved more aggressively
Indirect, Relational and Social Aggression Indirect: Harm is delivered covertly (verbal or physical) More common among girls up to age 18 Relational: Intent is to damage relationships or feelings of acceptance, friendship, or group membership (Generally more frequent among females) Social: Actions directed toward damaging another’s self-esteem, and/or social status (combines elements of both indirect and relational but adds harmful non-verbal behaviors Frequency of such behaviors on TV? More common than physical and verbal aggression, especially by attractive females whose behavior is often rewarded and justified (Coyne & Archer, 2004)
Participants and Method? 422 students in grades 6 -8 (US equivalent) 51% males 45% females Indirect/Social/Relational Aggression Scale (ISRA) ‘‘Think about all the other members of your year and the way they treated each other in the past week. Now circle the number of times that you either heard about or watched the following behaviors taking place in the past week.’’ Sample 1: Frequency Hearing someone say something nice about someone else 0 1 2 3 4 51 ‘‘Now think about how a person would feel if someone else did the following behaviors to them. Please circle how much you think that each of the behaviors would make a person feel sad or hurt.’’ Sample 2: Harmfulness Hearing someone say something nice about them 1——2——3——4
Gender Differences Frequency: Girls = Gossiping Boys: Making fun of others and hitting Harmfulness: Overall, girls viewed specific aggressive items as more harmful than boys, especially ones measuring indirect and direct relational aggressive behaviors
SUPREME COURT • Explicit sex • Community standards • Content is without redeeming social value Supreme Court Justice Potter Stewart: “I shall not today attempt further to define the kinds of material I understand to be embraced within that shorthand description [hard-core pornography]; and perhaps I could never succeed in intelligibly doing so. But I know it when I see it, and the motion picture involved in this case is not that.” • Jacobellis v. Ohio, 378 U.S. 184 (1964)
Antonio Allegri, known as Correggio1489?-1534Venus, Satyr and Cupidc. 1525 Nude in the Sunlight, 1876, 81x64,5cm. Paris, Musee d'Orsay. Jean-Jacques, known as James Pradier1790-1852Satyr and BacchanteDated 1834Marble Michelangelo's statue of "David."
Violence Against Women --- The Role of Violent vs. and Sexually Explicit Images • Some Film Type Studies: • Sexually explicit (e.g., X-rated) • Sexually aggressive (e.g., rape scenes) • Violence (e.g., murder, assault) • “Teen sex” films • Neutral Angered or not Effects on: Negative attitudes/perceptions towards females Reactions fo films (e.g., habituation, viewed as less offensive/violent) Violent behavior
From: Linz, D, G., Donnerstein, E., & Penrod, S. (1988). Effects of long-term exposure to violent and sexually degrading depictions of women. Journal of Personality and Social Psychology, 55, (5),758-768
Sample of all males who were angered or treated in a neutral manner by a female prior to viewing one of 3 different film types Donnerstein, E. (1980). Aggressive Erotica and Violence Against Women. Journal of Personality and Social Psychology, 39, 269-277
Participants watch 1 film per day for 5 days. Then served as jurors in a mock jury trial • Female viewed as more responsible for the attack • Female seen as resisting less • Female perceived as being hurt less severely • Less sympathy for the victim From: Linz, Donnerstein, and Penrod (1984).