Download
1 / 1
10 likes | 189 Vues
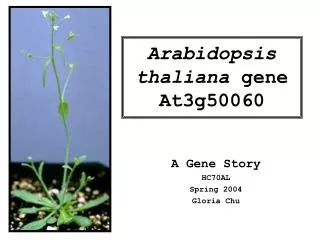
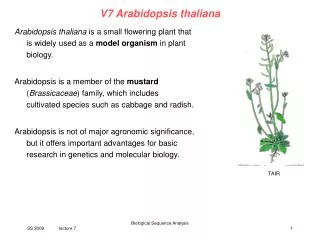
A Quantitative Analysis of Megagametogenesis in Two Species of Arabidopsis thaliana. Kasey Sanders Department of Biological Sciences, York College of Pennsylvania. Conclusion. Figure 1. Arabidopsis thaliana after flowering.

E N D
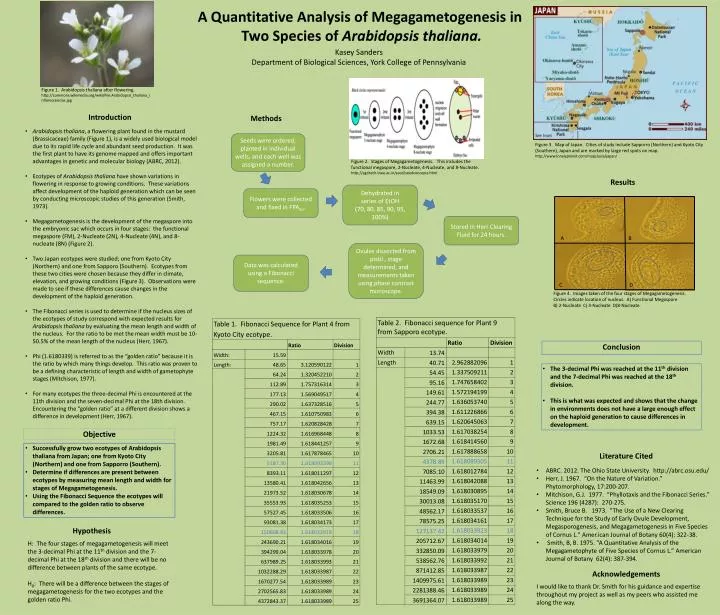
A Quantitative Analysis of Megagametogenesisin Two Species of Arabidopsis thaliana. Kasey Sanders Department of Biological Sciences, York College of Pennsylvania Conclusion Figure 1. Arabidopsis thaliana after flowering. http://commons.wikimedia.org/wiki/File:Arabidopsis_thaliana_inflorescencias.jpg Introduction • Arabidopsis thaliana, a flowering plant found in the mustard (Brassicaceae) family (Figure 1), is a widely used biological model due to its rapid life cycle and abundant seed production. It was the first plant to have its genome mapped and offers important advantages in genetic and molecular biology (ABRC, 2012). • Ecotypes of Arabidopsis thaliana have shown variations in flowering in response to growing conditions. These variations affect development of the haploid generation which can be seen by conducting microscopic studies of this generation (Smith, 1973). • Megagametogenesis is the development of the megaspore into the embryonic sac which occurs in four stages: the functional megaspore (FM), 2-Nucleate (2N), 4-Nucleate (4N), and 8-nucleate (8N) (Figure 2). • Two Japan ecotypes were studied; one from Kyoto City (Northern) and one from Sapporo (Southern). Ecotypes from these two cities were chosen because they differ in climate, elevation, and growing conditions (Figure 3). Observations were made to see if these differences cause changes in the development of the haploid generation. • The Fibonacci series is used to determine if the nucleus sizes of the ecotypes of study correspond with expected results for Arabidopsis thaliana by evaluating the mean length and width of the nucleus. For the ratio to be met the mean width must be 10-50.5% of the mean length of the nucleus (Herr, 1967). • Phi (1.6180339) is referred to as the “golden ratio” because it is the ratio by which many things develop. This ratio was proven to be a defining characteristic of length and width of gametophyte stages(Mitchison, 1977). • For many ecotypes the three-decimal Phi is encountered at the 11th division and the seven-decimal Phi at the 18th division. Encountering the “golden ratio” at a different division shows a difference in development (Herr, 1967). • The 3-decimal Phi was reached at the 11th division and the 7-decimal Phi was reached at the 18th division. • This is what was expected and shows that the change in environments does not have a large enough effect on the haploid generationto cause differences in development. Methods Seeds were ordered, planted in individual wells, and each well was assigned a number. Figure 3. Map of Japan. Cities of study include Sapporro (Northern) and Kyoto City (Southern), Japan and are marked by large red spots on map. http://www.lonelyplanet.com/maps/asia/japan/ Figure 2. Stages of Megagametogenesis. This includes the functional megaspore, 2-Nucleate, 4-Nucleate, and 8-Nucleate. http://agritech.tnau.ac.in/seed/seedconcepts.html Dehydrated in series of EtOH (70, 80, 85, 90, 95, 100%) Flowers were collected and fixed in FPA50. Stored in Herr Clearing Fluid for 24 hours. Ovules dissected from pistil , stage determined, and measurements taken using phase contrast microscope. Data was calculated using a Fibonacci sequence. Literature Cited • ABRC. 2012. The Ohio State University. http://abrc.osu.edu/ • Herr, J. 1967. “On the Nature of Variation.” Phytomorphology, 17:200-207. • Mitchison, G.J. 1977. “Phyllotaxis and the Fibonacci Series.” Science 196 (4287): 270-275. • Smith, Bruce B. 1973. "The Use of a New Clearing Technique for the Study of Early Ovule Development, Megasporogenesis, and Megagametogenesis in Five Species of Cornus L." Amer.ican Journal of Botany 60(4): 322-38. • Smith, B, B. 1975. “A Quantitative Analysis of the Megagametophyteof Five Species of Cornus L.” American Journal of Botany 62(4): 387-394. Objective • Successfully grow two ecotypes of Arabidopsis thaliana from Japan; one from Kyoto City (Northern) and one from Sapporro (Southern). • Determine if differences are present between ecotypes by measuring mean length and width for stages of Megagametogenesis. • Using the Fibonacci Sequence the ecotypes will compared to the golden ratio to observe differences. Results A B Acknowledgements I would like to thank Dr. Smith for his guidance and expertise throughout my project as well as my peers who assisted me along the way. Hypothesis H: The four stages of megagametogenesis will meet the 3-decimal Phi at the 11th division and the 7-decimal Phi at the 18th division and there will be no difference between plants of the same ecotype. H0: There will be a difference between the stages of megagametogenesis for the two ecotypes and the golden ratio Phi. Figure 4. Images taken of the four stages of Megagametogenesis. Circles indicate location of nucleus. A) Functional Megaspore B) 2-Nucleate C) 4-Nucleate D)8-Nucleate. C D