LEAN
LEAN. Roger Jones Joe Novello. Introductions. Historical Background. Baldridge Quality Framework. Leadership 1.0. Aim of the System (stakeholder) 3.0. Goals & MEASURES 2.0. Results 7.0. Faculty & Staff Focus 5.0. Processes 6.0. INFORMATION SYSTEMS 4.0.

LEAN
E N D
Presentation Transcript
LEAN Roger Jones Joe Novello
Historical Background • Baldridge Quality Framework
Leadership 1.0 Aim of the System (stakeholder) 3.0 Goals & MEASURES 2.0 Results 7.0 Faculty & Staff Focus 5.0 Processes 6.0 INFORMATION SYSTEMS 4.0 2000 Pinellas County Schools
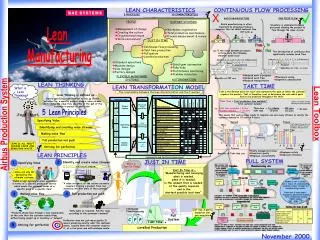
Historical Background • Baldridge Quality Framework • Lean manufacturing or lean production, which is often known simply as "Lean", is the optimal way of producing goods through the removal of waste and implementing flow. (Toyota) • LEAN/ Six Sigma • 99.997% error free
Eliminate Waste Lean Process Flowchart the process
What is waste in a process? Does it change the product? Is the customer willing to pay the price? Is it rework? If the answer to any of these is "No", then it is waste.
First Attempt Field Trip Permission Process
Findings - Wastes • Transportation was the major cause of time waste • Duplication of hard copies and filing wasted paper, staff time, and storage space
What is Quality? A customer perception NEVER defined by the provider Did I get – What I wanted? When I wanted it? For what I was willing to pay? Did it meet my expectations? If the answer is “YES”, the provider has Met quality objectives Created customer satisfaction If the answer is “Not exactly”, then you have incurred cost of poor quality.
What is Lean? Did I meet my quality objectives at the least possible cost? Accomplished by doing only value-added activities Knowing the difference between cost of doing business and the cost of poor quality
Lean – NOT Another “Efficiency” System A discipline and culture Focus on the customer Eliminating waste by doing only value-added Challenge EVERYTHING you do, including “legal”
Allay Fears Avoid the negative Lean = get the waste out • loss of jobs Emphasize the positive Lean = doing only value added • improved performance
Basic Tools – DMAIC – The Discipline Define the problem or opportunity (current state) Map and measure the current state Analyze. Drive to root cause Improve and implement the process (future state) Control the new process through measurement A circular process = continuous improvement
The Quality Management System Philosophy QMS How the philosophy is achieved System Procedures Day-to-day operating instructions Work Instructions Proof that you did what you documented Records
WHY? Why? Why? Why? Why? Basic Tools – Five Whys? Ask Why? five times! Can be obnoxious and highly annoying Pick up on the answer of the first Why to phrase the next one A good tool for developing fishbone diagrams
Coffee Water Basic Tools – Fishbone Diagram 2 days old Not filtered Not ground Coffee tastes terrible Hung over Dirty 40th birthday Coffee Pot Barista
TIM I WOODS – The Nine Sinful Wastes Transportation – moving things from one place to another Inventory – putting money into things you really don’t need Motion (movement) – having to reach, stoop Inspection – having to check someone else’s work Waiting – stopping the flow of a process Over-production – producing more than you need Over-processing – doing more than is required to achieve a result Defects – results that are not right when they are delivered underutilized Skills – not getting the most out of the brain trust
5-S • Sort - sort things used every day from the things that need to be saved • Search-free - get visual. Organize things so that you can see them and do not have to look for them • Spotless - keep things clean • Standardize - document your processes in simple instructions, and teach your staff the “right way” • Sustain - make it a way of life, but audit
Second Attempt From Requisition to Paycheck (Hiring Process)
Why Requisition to Paycheck • Complaints by principals and applicants: • Losing high quality candidates to other districts • Hiring process took up to three months • Open positions not being filled • Incorrect paychecks for new hires • 15 to 20 errors per month
Over sixty steps • Replication of data acquisition and input • Numerous opportunities for errors = REDO Analysis:
The Results • Short Term • All electronic applications eliminate Administrators traveling to the District Office, minimum $9000 and three to five days savings • Eliminate the Salmon Form, savings 10 – 20 hours overtime each month • “Jidoka” (Pull the rope) at three paycheck errors in a month
The Results • Long Term • Use the capabilities of the technology we have in place: • EPARS (requisition) • Edzapp (posting) • EPARS (processing) • VISIONS (Payroll)
The New Culture Think LEAN! Challenge everything we do. Does it add value?