Download
1 / 25
250 likes | 369 Vues
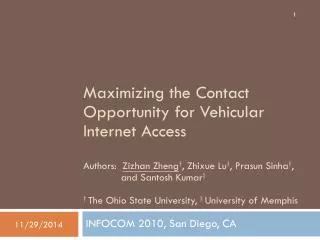
Maximizing the Contact Opportunity for Vehicular Internet Access Authors: Zizhan Zheng † , Zhixue Lu † , Prasun Sinha † , and Santosh Kumar § † The Ohio State University, § University of Memphis. INFOCOM 2010, San Diego, CA. TexPoint fonts used in EMF.

E N D
Maximizing the Contact Opportunity for Vehicular Internet AccessAuthors: Zizhan Zheng†, Zhixue Lu†, Prasun Sinha†, and Santosh Kumar§† The Ohio State University, § University of Memphis INFOCOM 2010, San Diego, CA TexPoint fonts used in EMF. Read the TexPoint manual before you delete this box.: AAAAA
Outline • Motivation • Three Metrics • Contact Opportunity in Distance • Contact Opportunity in Time • Average Throughput • Evaluations • Summary and Future Work
Motivation: Internet Access for Mobile Vehicles • Applications • Infotainment • Cargo tracking • Burglar tracking • Road surface monitoring • Current Approaches • Full Coverage • Opportunistic Service • Sparse Coverage
Current Approach I (of III): Full Coverage • Wireless Wide-Area Networking • 3G Cellular Network • 3GPP LTE (Long Term Evolution) • WiMAX • Either long range coverage (30 miles) or high data rates (75 Mbps per 20 MHz channel) • 3 Mbps downlink bandwidth reported in one of the first deployments in US (Baltimore, MD) • Google WiFi for Mountain View • 12 square miles, 500+ APs, 95% coverage • 1 Mbps upload and download rate • Not very practical for large scale deployment due to the prohibitive cost of deployment and management Google Wifi Coverage Map http://wifi.google.com/city/mv/apmap.html
Current Approach II (of III): Opportunistic Service via In-Situ APs Internet • Prototype • Drive-Thru Internet (Infocom’04,05) • In-Situ Evaluation • DieselNet (Sigcomm’08, Mobicom’08) • Interactive WiFi connectivity (Sigcomm’08) • Cost-performance trade-offs of three infrastructure enhancement alternatives (Mobicom’08) • MobiSteer (Mobisys’07) • Handoff optimization for a single mobile user in the context of directional antenna and beam steering • Cabernet (Mobicom’08) • Fast connection setup (QuickWiFi) and end-to-end throughput improvement (CTP) • Problems • Opportunistic service, no guarantee • Unpredictable interconnection gap AP AP AP
Current Approach III (of III): Sparse Coverage with Performance Guarantees • Basic Idea • Planned deployment • Sparse coverage with performance guarantees • Alpha Coverage (Infocom ’09 mini) • Placing an upper bound on the maximum diameter of coverage holes in a road network • Pure geometric • Does not correspond to the quality of data service directly
Contact Opportunity: A More Expressive Sparse Coverage Mode • Contact Opportunity – fractional distance/time within range of APs • Closer to user experience • Can be translated to average throughput if all uncertainties resolved • Our Approach • Worst Case perspective • Start with distance measure that involves least uncertainties • Extend to time measure by modeling road traffic • Further extend to average throughput by also modeling data rates, user density, and association
Contributions • Propose Contact Opportunity, an expressive sparse coverage mode. • Propose efficient solutions with provable performance bounds to maximize the worst-case Contact Opportunity with various uncertainties considered. • Develop the foundations towards providing scalable data service to disconnection-tolerant mobile users with guaranteed performance.
Outline • Motivation • Three Metrics • Contact Opportunity in Distance • Contact Opportunity in Time • Average Throughput • Evaluations • Summary and Future Work
Models and Assumptions • Road Network • An undirected graph G • Assumption 1: A set of candidate deployment locations is given, denoted as A. • Mobile Trace • A set of paths on G • Assumption 2: A set of frequently traveled paths is known, denoted as P. • AP Coverage • Geometric model is used • Assumption 3: The covered region for each candidate location is known (but not necessary a disk).
Contact Opportunity in Distance • For a subset SµA, a path p2P, the Contact Opportunity in Distance of p: • - the cost of S 200m 1000m
The Properties of Set Function ´d • The set function ´d(, p): 2A! [0,1] is • Normalized: ´d(;, p) = 0 • Nondecreasing: ´d(S, p) ·´d(T, p) if SµT • Submodular: adding a new AP to a small set helps more than adding it to a large set
Submodular Set Function • A set function F : 2A!R is submodular if for all SµTµA and a2AnT, F(S[ {a}) – F(S) ¸F(T[ {a}) – F(T) • Discrete counterpart of convexity • Example: F(S) = ´d(S, p) S a a T
Approximation Algorithm (for a relaxed version) • Hard to approximate directly • An instance of budgeted submodular set covering problem • No polynomial time approximation unless P = NP • Relaxing the budget B - a binary search based algorithm • For a given ¸ 2[0,1], solve the subproblem - find a deployment S of minimum cost that provides worst-case Contact Opportunity of ; • An instance of submodular set covering problem • A greedy algorithm has a logarithmic factor (L.A. Wolsey 1982) • If w(S) > B, a lower ¸ is used; otherwise, a higher ¸ is used; • Repeat until no higher ¸ can be achieved; output ¸ • OPT(B) achieved if ²B is allowed (Andreas Krause 2008) • OPT(B) - max-min Contact Opportunity of an optimal solution • ² - a logarithmic function of problem parameters
Contact Opportunity in Time • For a subset SµA, a path p2P, the Contact Opportunity in Time of p: • Challenge - uncertain contact time and travel time • Traffic jams, accidents, stop signs, etc. • Solution • Worst-Case perspective • Interval based modeling - for each road segment, an interval of possible travel times is known. 20s 10s 10s 10s 20s 200m 1000m
Contact Opportunity in Time (Cont.) • A traffic scenario k - an assignment of travel time (any value from the interval) to each road segment • kS - the worst traffic scenario • Unfortunately, ´t(S, p, kS) 8SµA is not submodular • Approximation by the “mean” scenario • “mean” scenario assigns the average travel time to each road segment • - an upper bound on the ratios of maximum and minimum travel times for all road segments • Factor achieved by using “mean” scenario
From Contact Opportunity to Average Throughput • More Assumptions • Each candidate location a2A is associated with a worst case data rate ra • The maximum number of users moving on each road segment is known • The maximum number of users in the range of an AP at a2A can be computed, denoted as va • A user always selects the AP with the highest normalized rate (ra/va) in range to associate • Handoff time is small enough to be ignored
From Contact Opportunity to Average Throughput (Cont.) • For a subset SµA, a path p2P, the Average Throughput when moving through p can be estimated as: • Solution similar to “Contact Opportunity in Time” • Limitations • Simplified association protocol • Fairness has been ignored 20s 10s 10s 10s 20s ra= 1 Mbps 2 2 3 200m 1000m
Outline • Motivation • Three Metrics • Contact Opportunity in Distance • Contact Opportunity in Time • Average Throughput • Evaluations • Summary and Future Work
Simulations • Baseline Algorithms • Uniform random sampling • Max-min distance sampling • Road network • A 6x6km2 region, 1802 intersections, • Obtained from 2008 Tiger/Line Shapefiles • Each edge is associated with an interval of travel speed [-5, ] (m/s), 2 [10,20] • Movements: all pair shortest paths ¸ 2km • Each AP has unit cost and a sector based coverage model with radius in [100,200](m) • To evaluate average throughput • Ns-2 based simulation • Restricted random waypoint • 1Mbps for each AP • CBR traffic
Simulation Results • A small controlled experiment in a parking lot at OSU (result in paper) Avg Throughput (2x2km2, 20 APs, 5 users) Min Contact Opp in Time Avg Contact Opp in Time
Outline • Motivation • Three Metrics • Contact Opportunity in Distance • Contact Opportunity in Time • Average Throughput • Evaluations • Summary and Future Work
Summary and Future Work • We have proposed Contact Opportunity, an expressive sparse coverage mode for providing data service to mobile users, and efficient solutions that maximize the worst-case Contact Opportunity with various uncertainties considered. • Future Work - Expected Contact Opportunity or Throughput • Offline - stochastic modeling of uncertainties on mobility and data flows • Online scheduling to improve fairness
Contact Opportunity in Time (Cont.) 24 • A traffic scenario k - an assignment of travel time (any value from the interval) to each road segment • KS - the worst traffic scenario that minimizes ´t (S, p) for each p, which assigns the minimum travel time to every segment covered by S and maximum travel time to every segment not covered
Contact Opportunity in Time (Cont.) 25 • Unfortunately, ´t(S, p, kS) 8SµA is normalized, nondecreasing, but not submodular • Approximation by a single scenario independent of S • “mean” scenario assigns the average travel time to each road segment, denoted as k0 • S0 - optimal deployment with respect to k0 • S* - optimal deployment with respect to kS • If the ratio between the maximum and the minimum travel time is bounded by for all road segments, then ´t(S*, p, kS*) · ´t(S0, p, kS0).