Download
1 / 21
230 likes | 262 Vues
Learn how to write and graph piecewise functions in algebra, and explore how they describe real-world scenarios. Understand the concept of step functions and how to evaluate various piecewise functions with different rules.

E N D
Piecewise Functions Holt Algebra 2
Objectives Can you write and graph piecewise functions? Can you use piecewise functions to describe real-world situations?
Vocabulary piecewise function step function
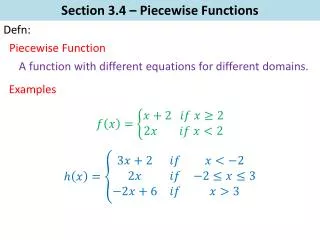
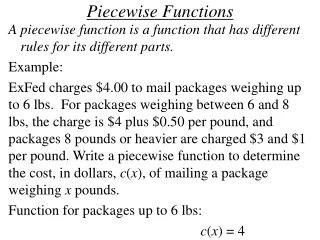
A piecewise function is a function that is a combination of one or more functions. The rule for a piecewise function is different for different parts, or pieces, of the domain. For instance, movie ticket prices are often different for different age groups. So the function for movie ticket prices would assign a different value (ticket price) for each domain interval (age group).
Example 1: Consumer Application What is the domain of this piecewise function?
Example 1 Continued $8 if
Example 2 From 8am til Noon 8≤x˂12(noon) From Noon til 4p 12≤x˂4 From 4p on x 4
Example 1 Continued $24 if 12≤x˂4 $12 if
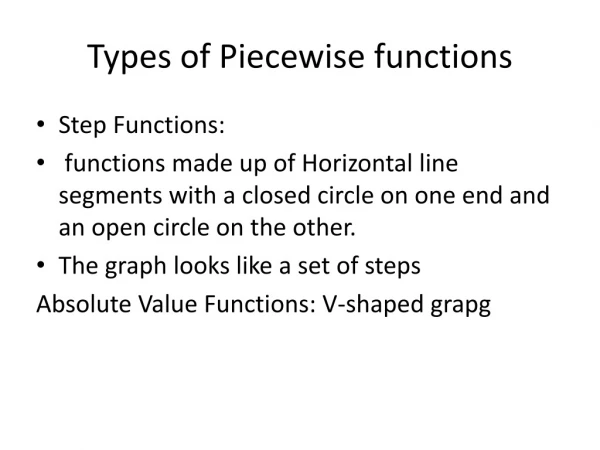
A piecewise function that is constant for each interval of its domain, such as the ticket price function, is called a step function. You can describe piecewise functions with a function rule.
Read this as “f of x is 5 if x is greater than 0 and less than 13, 9 if x is greater than or equal to 13 and less than 55, and 6.5 if x is greater than or equal to 55.”
To evaluate any piecewise function for a specific input, find the interval of the domain that contains that input and then use the rule for that interval.
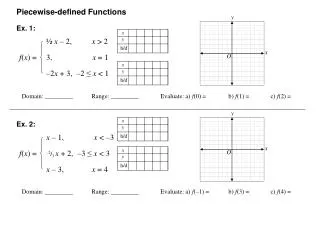
Example 3: Evaluating a Piecewise Function Evaluate each piecewise function for x = –1 and x = 4. 2x + 1 if x ≤ 2 h(x) = x2 – 4 if x > 2
Example 4: Evaluating a Piecewise Function Evaluate for x = -1 and x = 4. 2x if x ≤ –1 g(x) = 5x if x > –1
Example 5 Evaluate each piecewise function for x = –1 and x = 3. 12 if x < –3 15 if –3 ≤ x < 6 f(x) = 20 if x ≥ 6
Example 6 Evaluate each piecewise function for x = –1 and x = 3. 3x2 + 1 if x < 0 g(x) = 5x –2 if x ≥ 0
Example 7 Graph the function. 4 if x ≤ –1 f(x) = –2 if x > –1 The function is composed of two constant pieces that will be represented by two rays. Because the domain is divided by x = –1, evaluate both branches of the function at x = –1.
Example 7 Continued The function is 4 when x ≤–1, so plot the point (–1, 4) with a closed circle and draw a horizontal ray to the left. The function is –2 when x > –1, so plot the point (–1, –2) with an open circle and draw a horizontal ray to the right. ● O
Example 8 Graph the function. –3x if x < 2 g(x) = x + 3 if x ≥ 2 The function is composed of two linear pieces. The domain is divided at x = 2.
x + 2 if x ≤ 2 x + 3 if x > 2 1 2 Example 9 Graph the function, and evaluate at x = 1 and x = 3. p(x) =