
Leaf Leaching Experiment
E N D
Presentation Transcript
Leaf Leaching Experiment Monday PM David A. Reckhow University of Massachusetts
Introduction • Water treatment engineers and public health officials need to pay careful attention to the presence of dissolved organic matter in water supplies selected for human consumption (i.e., raw drinking waters). • For many reasons related to human health and cost, it is necessary to remove a substantial amount of these organic compounds before the water is ready for human use. The cost of doing this is highly variable and dependent on the particulars of the ecosystem from which the raw water originates. • In the Northeast US, a large fraction of aquatic organic matter found in lakes and rivers comes from the forest floor. We’re all familiar with organic-rich soils with upper soil horizons containing roots, branches, logs and leaves in various stages of decay.
Intro (cont.) • Thinking about the fate of plant biomass, many questions come to mind. • How much of this plant biomass degrades to CO2 and H2O in place (i.e., the process of mineralization), how much becomes incorporated in the soil below and how much becomes dissolved in pockets of water and is carried away to groundwater and surface water bodies (i.e., solubilization)? • How quickly does this happen and do leaves age and degrade at the same rate for all species under all conditions? • What are the steps in degradation and solubilization? • Does decomposition/degradation and solubilization occur at a constant rate, or an increasing or decreasing rate with time? Is there a lag phase?
Materials • Containers for leaching & imaging • Plastic Culture Flasks (75 mL), • Corning #430720; $3.70 each from Fisher Scientific • Plastic Aquarium • Kritter Keeper (Large), Lee’s Aquarium & Pet Products • $14 from local pet store • Scale (reading in grams) • I used a postal scale, but top loading balance is better • Plant Biomass • Your backyard • Tap Water • Camera, computer & ADI software
10 L aquaria • About 7 g of leaves B: Oak/Maple Aged 7 mo Blank: Tap water No leaves I: Goldenrod Fresh
Line Tool: Aquaria • xcz B I Blank
Aquaria vs Bottles • Different Pathlengths • 9 cm for bottles • 32 cm for aquaria (better for low level leaching) • Aquaria still have plant biomass • Bottles allow separation, or decantation of leaching mixture • Aquaria are good for producing large volumes of leachate (~10L) for later testing • Bottles (Culture flasks) hold ~75 mL
Photographic Image: Bottles • Blank in middle • Experimental on either side • 7g/tank • probably too low • White background • ID labels below
Line Tool • line
Line Tool: Color along line • All three B I Blank
Rectangle Tool • With image
Rectangle Tool: I bottle • histogram 50
Rectangle Tool: Blank bottle • blank 64
Rectangle Tool: B bottle • B sample 42
Data Analysis • Find location of blue peak for each rectangle on the color intensity scale • Calculate difference between this value and the value for the blank (tap water); this is the “color lost” • Plot “color lost” vs leaching time • This will show the accumulation of released colored organic matter from the leaves
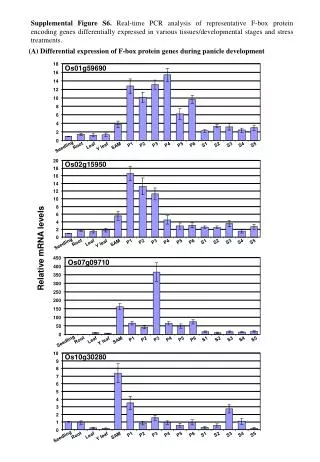
Leaching Rates • Leaching rates from the scientific literature • Amount released each week • Diminishes with time for some, accelerates for others From: Magill and Aber, 2000 Soil Biology & Biochemistry, vol. 32, pp.603-613
Composition of an “average” leaf • 250 g/m2/yr EABP Highly-colored Some color
Variations based on Species • Source: • Terrestrial Ecosystems • Aber & Melillo • 2nd edition • Harcourt Academic Press
Colored Compounds • Phenolic Acids • Readily released, highly colored • Lignin • Very slowly released, some color
Colorless Compounds • Simple sugars • Readily released, highly biodegradable • Starch • Easily released and also biodegradable • Cellulose & Hemicellulose • Slow to solubilize, not easily degraded
Constituents degrade at different rates • “Solubles” go first • Free carbohydrates are next • Bound or Lignified carbohydrates and Lignin are last
Solubilization vs Total Loss • DOC-C loss versus total C loss in mg C. Maple Y-axis values are mean leached DOC concentration for the 15 week treatment 33% solubilization Oak 12.5% Solubilization X-axis values are total C loss from litter. Pine Re-drawn from Magill and Aber, 2000
What to Do for the Leaching Tests? • Monday • Step 1: decide on plant material to use • Step 2: select and weigh out sufficient biomass • I’d recommend something between 20 and 100 grams • Step 3: add biomass to a plastic aquarium • Step 4: fill with tap water to 4 cm below top • This will give you a total volume of 10 Liters • Tuesday, Wednesday, Thursday • Collect one photographic image of aquarium next to blank • Friday • Collect final aquarium photo and begin treatment tests
Step 1: Select Leaves • Biomass smorgasbord
Extra Topic: Beer’s Law • Concentration of a pure solution of an absorbing compound is directly proportional to the logarithm of the light intensity for experimental (I) divided by the light intensity for the blank (Io) • This is the “Absorbance” Fixed value Fixed value