Download
1 / 49
490 likes | 642 Vues
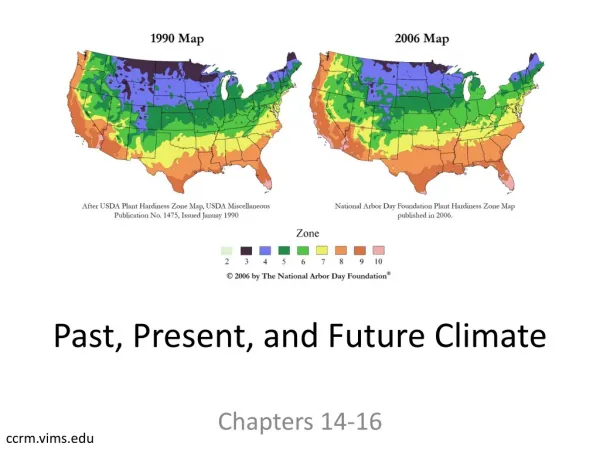
Past and Future Climate of Puget Sound and Implications for Decision Making. Nate Mantua and Lara Whitely Binder Climate Impacts Group University of Washington. Puget Sound Partnership webinar June 14, 2011. Climate Science in the Public Interest. CLIMATE is what you expect

E N D
Past and Future Climate of Puget Sound and Implications for Decision Making Nate Mantua and Lara Whitely Binder Climate Impacts Group University of Washington Puget Sound Partnership webinar June 14, 2011 Climate Science in the Public Interest
CLIMATE is what you expect WEATHER is what you get weather is the exact state of the atmosphere at a specific time and place weather elements: air temperature, air pressure, humidity, clouds, precipitation, visibility, wind
Sea-Tac average air temperatures: June 2010-June 2011 Climate is simply the statistics of weather: at right are 3 ways to view Sea-Tac’s observed daily temperatures from the past year Slide 2
Race Rocks sea surface temperature: 1921-2009 • Surface temperature variations for Puget Sound as a whole closely track those at Race Rocks • Note the large year-to-year changes, decadal cycles, and longer-term warming trend 1998 1941 1983 1958
Length of the Blue Glacier ~ 800 meter recession since the early 1900s, and ~1500 meter recession since the early 1800s The South Cascade glacier retreated dramatically in the 20th century 1928 Courtesy of the USGS glacier group 2000
El Niño and La Niña play a prominent role in causing year to year variations in Northwest Climate (especially our winter climate)
Warm phases PDO ENSO (El Niño) Source: Climate Impacts Group, University of Washington
Climate has varied over long time periods Last glacial maximum 18,000 years ago
Observed Impacts of 20th Century Climate Changes in the PNW Region • Warming trends over land and in the coastal ocean (~ 1.5 F/century), small trends in precipitation • Retreating glaciers • Declines in low elevation and Olympic Peninsula snowpack (at least from 1930s to 2007) • Timing shifts in snowmelt runoff (from 1948-2000) • Recent modeling studies suggest that ~35-60% of the observed hydrologic trends from 1950-99 across the western US are a consequence of human-caused global warming (Barnett et al. 2008: Science)
Four key points about the greenhouse effect and climate change • There is a natural Greenhouse Effect • Humans are strengthening the natural Greenhouse Effect by adding Greenhouse Gases to the atmosphere • Effects of a changing climate are already apparent • There is very likely much more human-caused global warming to come
Some Facts • Earth’s natural greenhouse effect warms surface temperatures by ~33°C (60°F) • H2O vapor the most powerful greenhouse gas (GG) • Other important GG’s are CO2, CH4, N2O, HFCs, PFCs, and SF6 … • Human caused emissions of these GG’s are increasing the natural greenhouse effect • Without drastic changes in current emissions trends, GG concentrations will increase dramatically in the next few centuries
Carbon-dioxide Concentrations • Seasonal changes driven by the “breathing” of the biosphere have been riding on top of a rising trend source - http://www.esrl.noaa.gov/gmd/ccgg/trends/
The Industrial Revolution and the Atmosphere The current concentrations of key greenhouse gases, and their rates of change, are unprecedented in the last 10,000 years. Carbon dioxide (CO2) Nitrous Oxide (N2O) Methane (CH4)
CO2 over the last 160,000 yr • Current concentrations are higher than any time in at least the past ~780,000 years • ~70% of CO2 emissions come from fossil fuel burning 2010 From a long term perspective, these changes are enormous
The planet has gotten warmer… The ten warmest years on record are since 1998; 2010 tied 2005 as the warmest year on record. 2001-2010 is the warmest decade on record.
A chain of assumptions and models are needed for developing future climate change scenarios • Start with a greenhouse gas emissions scenario • Either specify atmospheric concentrations, or use a carbon cycle model to develop them • Choose a global climate model - • 20 were used in the IPCC’s Fourth Assessment • Downscale the coarse resolution climate model output • To develop more realistic regional temperature and precipitation fields required for impacts (e.g. hydrologic, stream temperature) model inputs
How much CO2 will be released into the atmosphere? CO2 Emissions Scenarios CO2 Concentrations A1FI A2 A1FI A2 A1B A1B B1 B1 Estimates depend on population and economic projections, future choices for energy, governance/policy options in development (e.g., regional vs. global governance)
21st Century PNW Temperature and Precipitation Change Scenarios • Projected changes in temperature are large compared to historic variability • Changes in annual precipitation are generally small compared to past variations, but some models show large seasonal changes Mote and Salathé (2009): WACCIA
21st Century PNW Climate Scenarios Relative to Past Variability
A robust impact of climate warming: rising snowlines } for a ~ 2 °C warming Snoqualmie Pass 3022 ft
Key Impact: Loss of April 1 Snow Cover Medium -44% -29% -65% Elsner et al. 2009 Low -53% -27% -37% Why? Spring snowpack is projected to decline as more winter precipitation falls as rain rather than snow, especially in warmer mid-elevation basins. Also, snowpack will melt earlier with warmer spring temperatures
Runoff patterns are temperature dependent, but the basic response is more runoff and streamflow in winter and early spring, with less in late spring and early summer Puget Sound Precip a warmer climate Skagit 1900’s Oct Feb Jun Oct Feb Jun Puyallup Oct Feb Jun Skokomish Oct Feb Jun
Sea Level Rise (SLR) in the PNW Major determinants: Global SLR driven by the thermal expansion of the ocean; Global SLR driven by the melting of land-based ice; Atmospheric dynamics, i.e., wind-driven “pile-up” of water along the coast; and Local tectonic processes (subsidence and uplift)
Washington’s Coasts ? 50” 40” Rising sea levels will increase the risk of flooding, erosion, and habitat loss along much of Washington’s 2,500 miles of coastline. 30” ? 20” 13” 10” 6” 6” 3” 2050 2100 Projected sea level rise (SLR) in Washington’s waters relative to 1980-1999, in inches. Shading roughly indicates likelihood. The 6” and 13” marks are the SLR projections for the Puget Sound region and effectively also for the central and southern WA coast (2050: +5”, 2100: +11”). Global SLR: 7-23” by 2100 Medium estimates of SLR for 2100: +2” for the Olympic Peninsula +11” for the central coast+13” for Puget Sound Higher estimates (up to 4 feet by 2100) cannot be ruled out at this time.
Climate change and Natural Variations • Climate change may be manifest partly as a change in the relative frequency of natural variations (e.g., El Niños vs. La Niñas) • Likely changes with ENSO are very uncertain • It currently isn’t clear if ENSO will be stronger, weaker, or unchanged in a warmer future! (see Collins et al 2010, Nature Geosciences)
Box1 The future will not present itself in a simple, predictable way, as natural variations will still be important for climate change in any location oC Degrees C Overland and Wang EosTransactions (2007)
Modeled trends and variations in pH/Aragonite saturation states • Model scenario has aragonite saturation state at OS PAPA leaving historical range of variability in 2031 Cooley et al. (in press): Fish and Fisheries
Summary for Puget Sound Climate Change Scenarios • All climate model projections will be wrong • Emissions scenarios are stories about what might happen; informing climate system models with these stories yields “scenarios”, not predictions • Confidence in some aspects of climate and environmental change is higher than in others • Highest confidence is in rising air and water temperatures, increased ocean acidification, and rising sea levels • Lowest confidence in future precipitation, future wind patterns important for coastal upwelling, storminess and wave heights
Integrating Adaptation Into Planning Goal: Developing more “climate resilient” organizations, communities, economies, and ecosystems What does this mean? Taking steps to avoid or minimize those climate change impacts that can be anticipated while increasing the ability of human and natural systems to “bounce back” from the impacts that cannot be avoided (or anticipated)
The 4-As of Adaptation Planning 1. Awareness 2. Analysis 3. Action Climate resilience 4. Assessment 1. Awareness: Recognize that the past may no longer be a reliable guide to the future Workshops, briefings, reports Barrier: Planning paradigms rooted in the past 2. Analysis: Determine likely consequences of climate change for the specific sector or resource of interest Climate change scenarios for planning purposes Barrier: Lack of information 3. Action: Integrate climate change projections into planning processes Case studies in water resources, Adaptation guidebook Barrier: Lack of authority, guidance, and leadership 4. Assessment: Evaluate climate adaptation efforts in light of progress to date & emerging science Adapting monitoring programs, training Barrier: Costs, long time horizon of some impacts
Mainstreaming Planning Watershed Planning Program (EHSB 2514) Salmon recovery (ESHB 2496) Habitat conservation planning process Water supply planning Local land use planning Flood control planning Forest management plans Nearshore and coastal planning Water quality management (state, federal reqs) Others….
At its core, planning for climate change is about risk management How might (INSERT YOUR CONCERN HERE) affect my program’s goals and objectives? What are the consequences of those impacts? What steps can be taken to reduce the consequences?
Swinomish Indian Tribal Community: Climate Change Initiative Vulnerability assessment (2009) and adaptation plan (2010) Focused on impacts related to: sea level rise, storm surge, wildfire risk, extreme heat, changes in habitat, changing hydrology Shelter Bay, source: http://www.goskagit.com/home/article/shelter_bay_residents_bracing_for_increase/
Swinomish Indian Tribal Community: Climate Change Initiative (cont.) • Priority actions include (time frame if funded): • Delineating coastal protection zones (1-3 yrs) • Evaluate/study alternatives & solutions for impacts to sensitive coastal resources (shellfish, etc.) (3-5 yrs) • Establish dike maintenance authority and program for short-term support shoreline diking, where appropriate (3-5 yrs) • Establish/promote new reservation-wide program for wildfire risk mitigation (1-3 yrs) • Coordinator with local jurisdictions on regional access/mobility preservation (1-3 yrs)
City of Olympia: Planning for Sea Level Rise Future 20 Foot Tide…22” Increase Used LIDAR elevation data to refine land surface elevation measurements in the downtown area Mapped areas impacted by varying levels of sea level rise (represented by mapping of higher high tide levels)
City of Olympia: Planning for Sea Level Rise (contd.) • Looking at implications for the storm sewer & combined storm/sanitary sewer system • Invested in geological monitoring equipment to monitor land subsidence or uplifting • Consolidating # of stormwater outfalls (from 14 to 8) to reduce the number of possible entry points for marine water to flow into downtown • Analyzing potential shoreline sea walls/barriers • Incorporating sea rise issues in Comprehensive Plan and Shoreline Master Plan revisions
Washington DNR Aquatic Resources Program Staff surveys identified impacts on: aquaculture, overwater structures, log booming and storage, dredged materials, invasive species, derelict vessel removal Priority planning areas: sea level rise, providing public benefits Challenge: no authority over uplands that may ultimately becomes state-owned aquatic lands Source: CAKE adaptation database; photo source: CIG
Washington DNR Aquatic Resources Program cont. Recommended actions include: Incorporating climate change into internal/external activities, Encouraging climate-centric research and tools decision-support development, Education and outreach to aquatic lands lesees, Increased monitoring, Reducing non-climate stressors, Encouraging new uses of state-owned aquatic lands (e.g., wind and tidal energy), Facilitating managed retreat Source: CAKE adaptation database
Vulnerability of Wastewater Facilities to Flooding from Sea-Level Rise Developed and conducted GIS based methodology combining sea level rise projections + storm surge, compared to facility elevations Recommendations include: Raise elevation of Brightwater sampling facility and flow monitor vault sites. Raise weir height and install outfall flap gate for Barton Pump Station improvements. Conduct terrain analysis of five lowest sites and West Point Treatment Plant. Slide source: Matt Kuharic, King County
CIG’s Work with the 2011 Action Agenda • Developing written guidelines to help integrate climate change into strategies and near-term actions selection & prioritization. • Consulting and reviewing PSP work products related to target setting and strategy updates, including: • Working with PSP staff, technical experts, and consulting staff • Identification of key climate change-related scientific uncertainties about adaptation strategies that need to be reduced to make more informed policy choices • Analysis of draft Action Agenda and Biennial Science Work Plan for overall treatment of climate.
Closing Thoughts on Climate Impacts and Adapting to Climate Change Human activities are altering and will continue to alter 21st century climate. How we experience climate change is a function of natural variability and climate change. Projected “high confidence” impacts include increasing temperatures, sea level rise, ocean acidification, declining snowpack, and shifts in streamflow patterns and timing. Climate change is the new “norm”. Planning for climate change is a risk management activity, not being “green”. Adapting to climate change is not a one-time activity. Integrate climate change planning into existing decision making processes.
Floods Warm, low streamflow Salmon Affected Across Their Life-Cycle Earlier freshet & warmer, lower flows in summer Acidification warming, winds Modified from Wilderness Society (1993)
Impacts will vary depending on life history and watershed types • Low flows+warmer water = increased pre-spawn mortality for summer run and stream-type salmon and steelhead • Clear indications for increased stress on sockeye, summer steelhead, summer Chinook, and coho more generally • Increased winter flooding in transient rain+snow watersheds • a limiting factor for egg-fry survival for fall spawners + yearling parr overwinter survival in high-gradient reaches Harley Soltes/Seattle Times