Download

1 / 11
110 likes | 219 Vues
Microsoft Excel lets you turn your raw data into a variety of charts and graphs. Using this feature, you can visually summarize numerical information and display any trends or patterns that are present Charts and graphs can help make your data more meaningful and

E N D
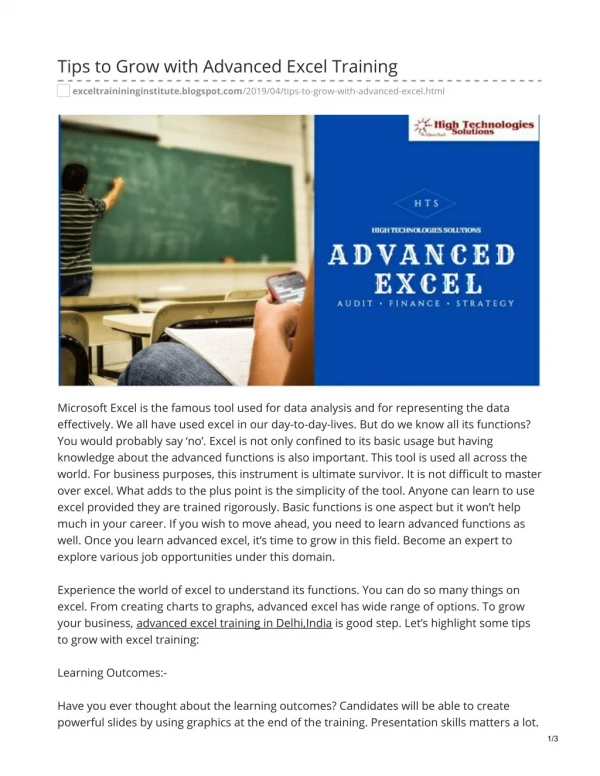
subject Advance Excel Training in Pune
Design and risk • Get a head start with templates • Set up an Excel template that will save you an hour each time you create a new workbook • Create new default workbook and worksheet templates • Learn how modular templates can make your spreadsheets more consistent and much quicker to set up • Your Excel, your way: customize the Excel interface to put the tools that you need at your fingertips. • Efficiency and Risk • Make spreadsheets more efficient and less risky • How to build in checks and controls from the outset • Key techniques that reduce risk and increase automation and efficiency
unctions & SuperPowers • Functions with superpowers • Finding the right functions and how they work • Functions with hidden powers – MOD() for patterns, OFFSET() for simple choices, INDIRECT() to manipulate formulae • Making references to ranges of cells adapt automatically for new data • Array formulae • One formula, one million calculations • SUMPRODUCT() - all the gain of an array formula with less of the pain • Tables – structure comes to Excel • Why Tables are so much more than just a new format • Make your spreadsheets more automatic with a single command
Excel interactivity • form Controls Use Form controls to make life easier for users • Use a Spin Button to choose a value easily • Use an Option Button to choose with a single click • Choosing from lists • Visual Basic and Macros • Create macros by writing Visual Basic code • A macro that performs one or more actions on selected cells • Write your own Excel functions with VB code • Understanding volatile functions • Trigger a macro when a particular cell is changed • Handling errors elegantly
Graphics I • Practical Interactivity with VBA • Exchanging information with VB code • Displaying a Message box • Asking for user input using an Input box • Create an Excel form with a List box containing values from a range of cells • Sample VB projects: an automatic index to sheets, printing selected ranges • Avoiding macros when they’re not really necessary • Conditional Formatting • Conditional Formatting • Basing conditions on a formula and deciding whether a batsman is out or not
Graphics II • Choose currency symbols for a whole sheet by changing a single cell • Getting your rules in the right order and knowing when to stop • Graphical Conditional Formats • Using invisibility to your advantage • Charts that Inspire • Create charts to inspire • What makes a good chart • Simple steps to make your charts clearer • Why small can be better than large • Are pie charts evil? • Why 3D charts can be 50% worse • Mixed chart types, trendlines and projections • Advanced chart techniques • Pictures in chart columns
Sparklines • in-cell charts • Careful with that Axis • The different types of Sparkline • Sparklines based on a dynamic data range • Graphics Tricks and Techniques • Further graphics tips and techniques • Taking dynamic pictures with the Excel camera • Use the Excel camera to combine areas from multiple sheets on the same sheet of paper • Formatting Excel Camera pictures • Power View
Turning data into decisions I • Excel 2013 Data Model create relationships • Advanced Uses of PivotTables • Use advanced PivotTable techniques • Calculated Fields and Calculated items • Using PivotTables as the calculation engine • Using GETPIVOTDATA() and CUBE • Excel 2010 and 2013 Slicers and Timelines • Working with Pivot Charts • Building and interactive dashboard using PivotTables and Slicers • Power Pivot
Turning data into decisions I • he Excel 2010 and 2013 • Power Pivot data tools • Calculations in Power Pivot • DAX in table columns • DAX to create new measures and calculated fields • Understanding advanced DAX expressions • the Time Intelligence DAX functions – why you need a table containing all possible dates • Reporting with Power Pivot • Creating powerful reports with Power Pivot • Hierarchies, Perspectives and Sets • Adding Key Performance Indicators (KPIs) to a Power Pivot report • Creating CUBE formulae • Use all these techniques