More than two groups: ANOVA and Chi-square
510 likes | 544 Vues
More than two groups: ANOVA and Chi-square. S1 a , n =28. S2 b , n =25. S3 c , n =21. P -value d. Calcium (mg). Mean. 117.8. 158.7. 206.5. 0.000. SD e. 62.4. 70.5. 86.2. Iron (mg). Mean. 2.0. 2.0. 2.0. 0.854. SD. 0.6. 0.6. 0.6. Folate (μg). Mean. 26.6. 38.7. 42.6.

More than two groups: ANOVA and Chi-square
E N D
Presentation Transcript
S1a, n=28 S2b, n=25 S3c, n=21 P-valued Calcium (mg) Mean 117.8 158.7 206.5 0.000 SDe 62.4 70.5 86.2 Iron (mg) Mean 2.0 2.0 2.0 0.854 SD 0.6 0.6 0.6 Folate (μg) Mean 26.6 38.7 42.6 0.000 SD 13.1 14.5 15.1 Zinc (mg) Mean 1.9 1.5 1.3 0.055 SD 1.0 1.2 0.4 ANOVA example Mean micronutrient intake from the school lunch by school a School 1 (most deprived; 40% subsidized lunches).b School 2 (medium deprived; <10% subsidized).c School 3 (least deprived; no subsidization, private school).dANOVA; significant differences are highlighted in bold (P<0.05). FROM: Gould R, Russell J, Barker ME. School lunch menus and 11 to 12 year old children's food choice in three secondary schools in England-are the nutritional standards being met? Appetite. 2006 Jan;46(1):86-92.
ANOVA (ANalysis Of VAriance) • Idea: For two or more groups, test difference between means, for normally distributed variables. • Just an extension of the t-test (an ANOVA with only two groups is mathematically equivalent to a t-test).
One-Way Analysis of Variance • Assumptions, same as ttest • Normally distributed outcome • Equal variances between the groups • Groups are independent
ANOVA • It’s like this: If I have three groups to compare: • I could do three pair-wise ttests, but this would increase my type I error • So, instead I want to look at the pairwise differences “all at once.” • To do this, I can recognize that variance is a statistic that let’s me look at more than one difference at a time…
Summarizes the mean differences between all groups at once. Analogous to pooled variance from a ttest. The “F-test” Is the difference in the means of the groups more than background noise (=variability within groups)?
The F-distribution • A ratio of variances follows an F-distribution: • The F-test tests the hypothesis that two variances are equal. • F will be close to 1 if sample variances are equal.
ANOVA example • Randomize 33 subjects to three groups: 800 mg calcium supplement vs. 1500 mg calcium supplement vs. placebo. • Compare the spine bone density of all 3 groups after 1 year.
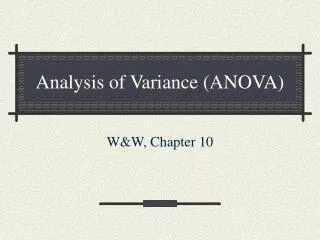
Between group variation Within group variability Within group variability Within group variability Spine bone density vs. treatment 1.2 1.1 1.0 S P I N E 0.9 0.8 0.7 PLACEBO 800mg CALCIUM 1500 mg CALCIUM
Group means and standard deviations • Placebo group (n=11): • Mean spine BMD = .92 g/cm2 • standard deviation = .10 g/cm2 • 800 mg calcium supplement group (n=11) • Mean spine BMD = .94 g/cm2 • standard deviation = .08 g/cm2 • 1500 mg calcium supplement group (n=11) • Mean spine BMD =1.06 g/cm2 • standard deviation = .11 g/cm2
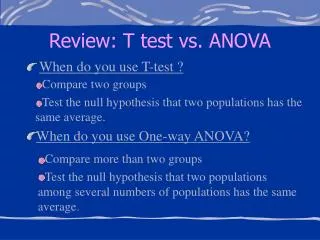
The size of the groups. Between-group variation. The difference of each group’s mean from the overall mean. Large F value indicates that the between group variation exceeds the within group variation (=the background noise). The average amount of variation within groups. Each group’s variance. The F-Test
Review Question 1 Which of the following is an assumption of ANOVA? • The outcome variable is normally distributed. • The variance of the outcome variable is the same in all groups. • The groups are independent. • All of the above. • None of the above.
Review Question 1 Which of the following is an assumption of ANOVA? • The outcome variable is normally distributed. • The variance of the outcome variable is the same in all groups. • The groups are independent. • All of the above. • None of the above.
ANOVA summary • A statistically significant ANOVA (F-test) only tells you that at least two of the groups differ, but not which ones differ. • Determining which groups differ (when it’s unclear) requires more sophisticated analyses to correct for the problem of multiple comparisons…
Question: Why not just do 3 pairwise ttests? • Answer: because, at an error rate of 5% each test, this means you have an overall chance of up to 1-(.95)3= 14% of making a type-I error (if all 3 comparisons were independent) • If you wanted to compare 6 groups, you’d have to do 15 pairwise ttests; which would give you a high chance of finding something significant just by chance.
Correction for multiple comparisons How to correct for multiple comparisons post-hoc… • Bonferroni correction (adjusts p by most conservative amount; assuming all tests independent, divide p by the number of tests) • Tukey (adjusts p) • Scheffe (adjusts p)
Obtained P-value Original Alpha # tests New Alpha Significant? .001 .05 5 .010 Yes .011 .05 4 .013 Yes .019 .05 3 .017 No .032 .05 2 .025 No .048 .05 1 .050 Yes 1. Bonferroni For example, to make a Bonferroni correction, divide your desired alpha cut-off level (usually .05) by the number of comparisons you are making. Assumes complete independence between comparisons, which is way too conservative.
2/3. Tukey and Sheffé • Both methods increase your p-values to account for the fact that you’ve done multiple comparisons, but are less conservative than Bonferroni (let computer calculate for you!).
Review Question 2 I am doing an RCT of 4 treatment regimens for blood pressure. At the end of the day, I compare blood pressures in the 4 groups using ANOVA. My p-value is .03. I conclude: • All of the treatment regimens differ. • I need to use a Bonferroni correction. • One treatment is better than all the rest. • At least one treatment is different from the others. • In pairwise comparisons, no treatment will be different.
Review Question 2 I am doing an RCT of 4 treatment regimens for blood pressure. At the end of the day, I compare blood pressures in the 4 groups using ANOVA. My p-value is .03. I conclude: • All of the treatment regimens differ. • I need to use a Bonferroni correction. • One treatment is better than all the rest. • At least one treatment is different from the others. • In pairwise comparisons, no treatment will be different.
Chi-square test of Independence Chi-square test allows you to compare proportions between 2 or more groups (ANOVA for means; chi-square for proportions).
Example • Asch, S.E. (1955). Opinions and social pressure. Scientific American, 193, 31-35.
The Experiment • A Subject volunteers to participate in a “visual perception study.” • Everyone else in the room is actually a conspirator in the study (unbeknownst to the Subject). • The “experimenter” reveals a pair of cards…
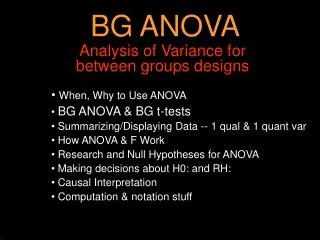
The Task Cards Standard line Comparison lines A, B, and C
The Experiment • Everyone goes around the room and says which comparison line (A, B, or C) is correct; the true Subject always answers last – after hearing all the others’ answers. • The first few times, the 7 “conspirators” give the correct answer. • Then, they start purposely giving the (obviously) wrong answer. • 75% of Subjects tested went along with the group’s consensus at least once.
Further Results • In a further experiment, group size (number of conspirators) was altered from 2-10. • Does the group size alter the proportion of subjects who conform?
Conformed? Number of group members? 2 4 6 8 10 Yes 20 50 75 60 30 No 80 50 25 40 70 The Chi-Square test Apparently, conformity less likely when less or more group members…
20 + 50 + 75 + 60 + 30 = 235 conformed • out of 500 experiments. • Overall likelihood of conforming = 235/500 = .47
Conformed? Number of group members? 2 4 6 8 10 Yes 47 47 47 47 47 No 53 53 53 53 53 Expected frequencies if no association between group size and conformity…
Do observed and expected differ more than expected due to chance?
Degrees of freedom = (rows-1)*(columns-1)=(2-1)*(5-1)=4 Chi-Square test
Degrees of freedom = (rows-1)*(columns-1)=(2-1)*(5-1)=4 Chi-Square test Rule of thumb: if the chi-square statistic is much greater than it’s degrees of freedom, indicates statistical significance. Here 85>>4.
Interpretation • Group size and conformity are not independent, for at least some categories of group size • The proportion who conform differs between at least two categories of group size • Global test (like ANOVA) doesn’t tell you which categories of group size differ
Review Question 8 I divide my study population into smokers, ex-smokers, and never-smokers; I want to compare years of schooling (a normally distributed variable) between the three groups. What test should I use? • Repeated-measures ANOVA. • One-way ANOVA. • Difference in proportions test. • Paired ttest. • Chi-square test.
Review Question 8 I divide my study population into smokers, ex-smokers, and never-smokers; I want to compare years of schooling (a normally distributed variable) between the three groups. What test should I use? • Repeated-measures ANOVA. • One-way ANOVA. • Difference in proportions test. • Paired ttest. • Chi-square test.
Review Question 9 I divide my study population into smokers, ex-smokers, and never-smokers; I want to compare the proportions of each group that went to graduate school. What test should I use? • Repeated-measures ANOVA. • One-way ANOVA. • Difference in proportions test. • Paired ttest. • Chi-square test.
Review Question 9 I divide my study population into smokers, ex-smokers, and never-smokers; I want to compare the proportions of each group that went to graduate school. What test should I use? • Repeated-measures ANOVA. • One-way ANOVA. • Difference in proportions test. • Paired ttest. • Chi-square test.
Practice Problem: • Suppose the following data were collected on a random (cross-sectional) sample of teenagers (exposure divided into high and low at the median): Is there an association between exposure to smoking in movies and smoking behavior?
Ever Smoked Never smoked High exposure smoking in film 65 100 335 300 400 Low exposure 30 65 335 370 400 130 670 800 EXPECTED TABLE: Chi-square test for a 2x2 table… psmoker*phigh exposure=.1625*.50=.08125 Expected in cell a=.08125*800=65 65 in cell c; 335 in cell b; 335 in cell d
Ever Smoked Never smoked High exposure smoking in film 65 100 335 300 Low exposure 65 30 335 370 EXPECTED TABLE: Smoking data, use Chi-square test
Caveat **When the sample size is very small in any cell (<5), Fisher’s exact test is used as an alternative to the chi-square test.
Continuous outcome Binary predictor Continuous predictors Overview of statistical tests The following table gives the appropriate choice of a statistical test or measure of association for various types of data (outcome variables and predictor variables) by study design. e.g., blood pressure= pounds + age + treatment (1/0)
Types of variables to be analyzed Statistical procedure or measure of association Predictor variable/s Outcome variable Categorical Continuous ANOVA Binary Continuous T-test Continuous Binary Continuous Ranks/ordinal Simple linear regression Wilcoxon sum-rank Cross-sectional/case-control studies Multivariate (categorical and continuous) Multivariate (categorical and continuous) Continuous Continuous Multiple linear regression Multiple linear regression Categorical Categorical Chi-square test(or Fisher’s exact) Binary Binary Odds ratio, risk ratio Multivariate Multivariate Dichotomous Dichotomous Logistic regression Logistic regression Binary Risk ratio Binary Categorical Kaplan-Meier curve/ log-rank test Time-to-event Multivariate Multivariate Time-to-event Time-to-event Cox-proportional hazards regression, hazard ratio Cox-proportional hazards regression, hazard ratio Cohort Studies/Clinical Trials