Download
1 / 65
660 likes | 904 Vues
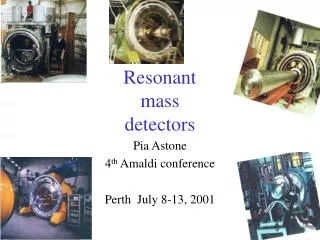
Resonant Mass Gravitational Wave Detectors David Blair University of Western Australia. Historical Introduction Intrinsic Noise in Resonant Mass Antennas Transducers Transducer-Antenna interaction effects Suspension and Isolation Data Analysis. Sources and Materials.

E N D
Resonant Mass Gravitational Wave DetectorsDavid BlairUniversity of Western Australia • Historical Introduction • Intrinsic Noise in Resonant Mass Antennas • Transducers • Transducer-Antenna interaction effects • Suspension and Isolation • Data Analysis
Sources and Materials • These notes are about principles and not projects. • Details of the existing resonant bar network may be found on the International Gravitational Events Collaboration web page. • References and some of the content can be found in • Ju, Blair and ZhouRep Prog Phys 63,1317,2000. • Online at www.iop.org/Journals/rp • Draft of these notes available www.gravity.uwa.edu.au
Existing Resonant Bar Detectors and sphere developments • Sphere developments • Leiden • Frascati • Sao Paulo
Weber’s Pioneering Work • Joseph Weber Phys Rev 117, 306,1960 • Mechanical Mass Quadrupole Harmonic Oscillator: Bar, Sphere or Plate • Designs to date: Bar Sphere Torsional Quadrupole Oscillator Weber’s suggestions: Earth: GW at 10-3 Hz. Piezo crystals: 107 Hz Al bars: 103 Hz Detectable flux spec density: 10-7Jm-2s-1Hz-1 ( h~ 10-22 for 10-3 s pulse)
Gravity Wave Burst Sources and Detection Energy Flux of a gravitational wave: J m-2 s-1 Short Bursts of duration tg Assume J m-2 s-1 Total pulse energy density EG = S.tg Jm-2
Flux Spectral Density Bandwidth of short pulse: Dw ~ 1/tg Reasonableto assume flat spectrum: F(w) ~ E/ Dw ~E.tg ie: J.m-2.Hz-1 For short bursts: F(w) ~ 20 x 1034 h2 Gravitational wave bursts with tg~10-3s were the original candidate signals for resonant mass detectors. However stochastic backgrounds and monochromatic signals are all detectable with resonant masses.
Black Hole Sources and Short Bursts Start with Einstein’s quadrupole formula for gravitational wave luminosity LG: where the quadrupole moment Djk is defined as: Notice: for a pair of point masses D=ML2 , for a spherical mass distribution D=0 for a binary star system in circular orbit D varies as sin2wt
Burst Sources Continued Notice also that represents non-spherical kinetic energy ie the kinetic energy of non-spherically symmetric motions. For binary stars (simplest non sperically symmetric source), projected length (optimal orientation) varies sinusoidally, D~ML2sin22wt, The numerical factor comes from the time average of the third time derivative of sin2wt. Now assume isotropic radiation but also use Note that KE=1/2Mv2= 1/8ML2w2
To order of magnitude and Maximal source: Ens=Mc2……merger of two black holes In general for black hole births Here e is conversion efficiency to gravitational waves
Weber’s Research • Weber used arguments such as the above to show that gravitational waves created by black hole events near the galactic centre could create gravitational wave bursts of amplitude as high as 10-16. • He created large Al bar detectors able to detect such signals. • He identified many physics issues in design of resonant mass detectors. • His results indicated that 103 solar masses per year were being turned into gravitational waves. • These results were in serious conflict with knowledge of star formation and supernovae in our galaxy. • His data analysis was flawed. • Improved readout techniques gave lower noise and null results.
Energy deposited in a resonant mass Energy deposited in a resonant mass EG s is the frequency dependent cross section F is the spectral flux density Treat F as white over the instrument bandwidth Then Paik and Wagoner showed for fundamental quadrupole mode of bar:
Energy and Antenna Pattern for Bar z Energy deposited in an initially stationary bar Us Us=F(wa).sin4qsin22f y Sphere is like a set of orthogonal bars giving omnidirectional sensitivity and higher cross section Incoming wave x
Detection Conditions Noise energy Un • Detectable signal Us • Transducer: 2-port device: computer • Amplifier , gain G, has effective current noise spectral density Si and voltage noise spectral density Se Forward transductance Z21(volts m-1s-1) Mechanical input impedance Z11 Reverse transductance Z12 (kg-amp-1) Electrical output impedance Z22
multiply b Resonant mass transducer G X X2=Acosf 0o 90o Vsinwat ~ Reference oscillator Bar, Transducer and Phase Space Coordinates X1=Asinf Asin(wat+f) • b determines time for transducer to reach equilibrium • X1 and X2 are symmetrical phase space coordinates • Antenna undergoes random walk in phase space • Rapid change of state measured by length of vector (P1,P2) • High Q resonator varies its state slowly
Two Transducer Concepts Direct Parametric • Signal at antenna frequency • Critical requirements: low noise SQUID amplifier low mechanical loss circuitry • Signal detected as modulation of pump frequency • Critical requirements: low pump noise low noise amplifier at modulation frequency
Mechanical Impedance Matching • High bandwidth requires good impedance matching between acoustic output impedance of mechanical system and transducer input impedance • Massive resonators offer high impedance • All electromagnetic fields offer low impedance (limited by energy density in electromagnetic fields) • Hence mechanical impedance trasformation is essential • Generally one can match to masses less than 1kg at ~1kHz
Mechanical model of transducer with intermediate mass resonant transformer Resonant transformer creates two mode system Two normal modes split by
Bending flap secondary resonator Microwave cavity
9.049GHz 451MHz Composite Oscillator Filter RF SO Frequency servo 9.501GHz Cryogenic components Phase servo Transducer Microstrip antennae Filter Mixers Phase shifters Bar Microwave interferometer Electronically adjustable phase shifter & attenuator Bending flap S D mW-amplifier Spare mW-amplifier Primary mW-amplifier Data Acquisition j j j a Microwave Readout System of NIOBÉ (upgrade)
Direct Mushroom Transducer A superconducting persistent current is modulated by the motion of the mushroom resonator and amplified by a DC SQUID.
Three Mode Niobium Transducer (LSU) • Two secondary resonators • Three normal modes • Easier broadband matching • Mechanically more complex
Three general classes of noise Brownian Motion Noise kT noise energy Back Action Noise Series Noise Broadband Amplifier noise, pump phase noise or other additive noise contributions. Series noise is usually reduced if transductance Z21 is high. Always increases with bandwidth Amplifier noise acting back on antenna. Unavoidable since reverse transductance can never be zero. A fluctuating force indistingushable from Brownian motion. Low loss angle f compresses thermal noise into narrow bandwidth at resonance. Decreases for high bandwidth.(small ti)
Noise Contributions Total noise referred to input: Reduces as ti/ta because of predictability of high Q oscillator Reduces as ti/M because fluctuations take time to build up and have less effect on massive bar Increases as M/ti reduces due to increased bandwidth of noise contribution, and represents increased noise energy as referred to input
QuantumLimits Noise equation shows any system has minimum noise level and optimum integration time set by the competing action of series noise and back action noise. Since a linear amplifier has a minimum noise level called the standard quantum limit this translates to a standard quantum limit for a resonant mass. Noise equation may be rewritten where A is Noise Number: equivalent number of quanta. The sum AB+AS cannot reduce below~1: the Standard Quantum Limit Burst strain limit~10-22 (100t sphere) corres to h(w)~3.10-24
Thermal Noise Limit Thermal noise only becomes negligible for Q/T>1010 (100Hz bandwidth) (Q=ta/w) Thermal noise makes it difficult to exceed hSQL
Ideal Parametric Transducer • Noise temperature characterises noise energy of any system. • Since photon energy is frequency dependent, noise number is more useful. • Amplifier effective noise temperature must be referred to antenna frequency • For example wa = 2p x 700Hz wpump= 2p x 9.2 GHz • Tn = 10K: Hence and Teff = 8 10-7 K • Cryogenic microwave amplifiers greatly exceed the performance of any existing SQUID and have robust performance • Oscillator noise and thermal noise degrade system noise
Non-filtered output mW-amplifier j BPF DC Bias LOOP OSCILLATOR + varactor f Circulator + Sapphire loaded cavity resonator Qe~3107 Microwave Interferometer Filtered output mW-amplifier RF LO mixer LNA Phase error detector Loop filter Pump Oscillators for Parametric Transducer A low noise oscillator is an essential component of a parametric transducer A stabilised NdYAG laser provides a similar low noise optical oscillator for optical parametric transducers and for laser interferometers which are similar parametric devices.
Coupling and Transducer Scattering Picture Treat transducer as a photon scatterer Signal phonons wa w+=wp+wa ? Output sidebands transducer w-=wp-wa Pump photons wp Because transducer has negligible loss use energy conservation to understand signal power flow- Manley-Rowe relations. Formal solution but results are intuitively obvious Note that power flow may be altered by varying b asper previous slide
Parametric transducer damping and elastic stiffness Cold damping of bar modes by parametric transducer Lower mode Upper mode Bar mode frequencytuning by pump tuning
Electromechanical Coupling of Transducer to Antenna signal energy in transducer b= signal energy in bar • In direct transducer b = (1/2CV2)/Mw2x2 • In parametric transducer b=(wp/wa)(1/2CV2)/Mw2x2 • Total sideband energy is sum of AM and PM sideband energy, depends on pump frequency offset
Manley-Rowe Solutions If wp>>wa, Pp ~ -(P++P-). If P+/w+ < P-/w-,then Pa< 0…..negative power flow…instability If P+/w+ > P-/w-,then Pa> 0…..positive power flow…cold damping By manipulating b using offset tuning can cold-damp the resonator…very convenient and no noise cost. Enhance upper sideband by operating with pump frequency below resonance.
Offset tuning to vary Q and b in high Q limit If transducer cavity has a Qe>wp/wa , thenb is maximised near the cavity resonance or at the sideband frequencies. Strong cold damping is achieved for wp=wcavity-wa .
Thermal noise contributions from bar and secondary resonator Secondary resonator m2Hz-1 bar Frequency Hz Thermal noise components for a bar Q=2 x10⁸ (antiresonance at mid band) and secondary resonator Q=5 x 10⁷
Transducer Optimisation Spectral Strain sensitivity Low b, high series noise, low back action noise SNR/Hz/mK This and the following curves from M Tobar Thesis UWA 1993
Reduced Am noise Spectral Strain sensitivity SNR/Hz/mK
Higher secondary mass Q-factor Spectral Strain sensitivity SNR/Hz/mK
Reduced back action noise from pump AM noise Spectral Strain sensitivity SNR/Hz/mK
High Qe, high coupling Spectral Strain sensitivity SNR/Hz/mK
Relations between Sensitivity and Bandwidth Minimum detectable energy is defined by the ratio of wideband noise to narrow band noise Express minimum detectable energy as an effective temperature Bandwidth and minimum detectable burst depends on transducer and amplifier Optimum spectral sensitivity depends on ratio Independent of readout noise
Burst detection: maximum total bandwidth important Search for pulsar signals (CW) in spectral minima. More bandwidth=more sources at same sensitivity Stochastic background: use two detectors with coinciding spectral minima
Improving Bar Sensitivity with Improved Transducers Two mode, low b, high series noise High b, low noise,3 mode
Optimal filter Signal to noise ratio is optimised by a filter which has a transfer function proportional to the complex conjugate of the signal Fourier transform divided by the total noise spectral density Fourier tfm of impulse response of displacement sensed by transducer for force input to bar Fourier tfm of input signal force Double sided spectral density of noise refered to the transducer displacement
Monochromatic and Stochastic Backgrounds Stochastic Background: Cross correlate between independent detectors. Thermal noise is independent and uncorrelated between detectors. Monochromatic (or slowly varying) : (eg Pulsar signals):Long term coherent integration or FFT Very narrow bandwidth detection outside the thermal noise bandwidth. Both methods allow the limits to bursts to be easily exceeded.