Download
1 / 51
510 likes | 644 Vues
This chapter delves into the foundations of macroeconomics, covering key topics such as economic growth, unemployment fluctuations, inflation trends, and the significance of surpluses and deficits. Discover the evolution of macroeconomic thought from the Great Depression to modern-day practices and understand the implications of various economic indicators. Additionally, learn about the policy tools governments employ to steer economic stability and respond to challenges. Equip yourself with insights to contemplate the future of employment and economic prosperity.

E N D
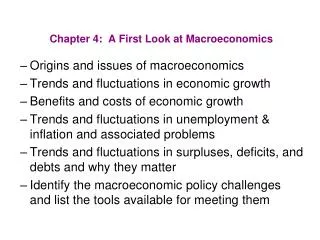
20 CHAPTER A First Look at Macroeconomics
After studying this chapter you will be able to • Describe the origins and issues of macroeconomics • Describe the trends and fluctuations in economic growth and explain the benefits and costs of economic growth • Describe the trends and fluctuations in unemployment and explain why unemployment is a problem • Describe the trends and fluctuations in inflation and the value of the dollar and explain why inflation is a problem • Describe the trends and fluctuations in surpluses, deficits, and debts and explain why they matter • Identify the macroeconomic policy challenges and list the tools available for meeting them
What Will Your World Be Like? • Will tomorrow’s world be more prosperous than today? • Will jobs be plentiful? • Will the cost of living be stable? • Will the government’s and the nation’s deficit continue to increase? • What macroeconomic policy tools does the government have to steer the course of the economy?
Origins and Issues of Macroeconomics • Economists began to study economic growth, inflation, and international payments during the 1750s. • Modern macroeconomics dates from the Great Depression, a decade (1929-1939) of high unemployment and stagnant production throughout the world economy. • John Maynard Keynes book, The General Theory of Employment, Interest, and Money, began the subject.
Origins and Issues of Macroeconomics • Short-Term Versus Long-Term Goals • Keynes focused on the short-term—on unemployment and lost production. • “In the long run,” said Keynes, “we’re all dead.” • During the 1970s and 1980s, macroeconomists became more concerned about the long-term—inflation and economic growth.
Economic Growth and Fluctuations • Economic growth is the expansion of the economy’s production possibilities—an outward shifting PPF. • We measure economic growth by the increase in real GDP. • Real GDP (real gross domestic product)is the value of the total production of all the nation’s farms, factories, shops, and offices, measured in the prices of a single year.
Economic Growth and Fluctuations • Economic Growth in the United States • Figure 20.1 shows real GDP in the United States from 1960 to 2005. • The figure highlights: • Growth of potential GDP • Fluctuations of real GDP around potential GDP
Economic Growth and Fluctuations • Growth of Potential GDP • Potential GDP is the value of production when all the economy’s labor, capital, land, and entrepreneurial ability are fully employed. • During the 1970s, the growth of output per person slowed—a phenomenon called the productivity growth slowdown.
Economic Growth and Fluctuations • Fluctuations of Real GDP Around Trend • Real GDP fluctuates around potential GDP in a business cycle—a periodic but irregular up-and-down movement in production.
Economic Growth and Fluctuations • Every business cycle has two phases: • 1. A recession • 2. An expansion • and two turning points: • 1. A peak • 2. A trough • Figure 20.2 on the next slide illustrates these features of the business cycle.
Economic Growth and Fluctuations • Most recent business cycle in the United States
Economic Growth and Fluctuations • A recession is a period during which real GDP decreases for at least two successive quarters. • An expansion is a period during which real GDP increases.
Economic Growth and Fluctuations • Figure 20.3 shows the long-term growth trend and cycles.
Economic Growth and Fluctuations • Economic Growth Around the World • Figure 20.4(a) compares the growth rate of real GDP per person in the United States with that for the rest of the world as a whole.
Economic Growth and Fluctuations • Figure 20.4(b) compares economic growth in the United States with that in other countries and regions from 1996 to 2006. • Among the advanced economies, Japan has grown slowest and the newly industrialized Asian economies have grown fastest.
Economic Growth and Fluctuations • Among the developing economies, Central and South America have grown slowest and Asia has grown fastest. • The world has grown a bit faster than the United States.
Economic Growth and Fluctuations • The Lucas Wedge and Okun Gap • How costly are the growth slowdown and the lost output over the business cycle? • To answer that question we measure: • The Lucas wedge • The Okun gap
Economic Growth and Fluctuations • The Lucas Wedge • The Lucas wedge is the accumulated loss of output from the productivity growth slowdown of the 1970s . • Figure 20.5(a) shows that the Lucas wedge is $72 trillion or 6.5 times the real GDP in 2005.
Economic Growth and Fluctuations • The Okun Gap • Real GDP minus potential GDP is the output gap. • A negative output gap is called an Okun gap. • Figure 20.5(b) shows the Okun gap from recessions since 1973 is $3.3 trillion or about 30 percent of real GDP in 2005.
Economic Growth and Fluctuations • Benefits and Costs of Economic Growth • The Lucas wedge is a measure of the dollar value of lost real GDP if the growth rate slows. This cost translates into real goods and services. • It is a cost in terms of less health care for the poor and elderly, less cancer and AIDS research, worse roads, and less to spend on clean air, more trees, and cleaner lakes. • But fast growth is also costly. Its main costs is forgone current consumption. To sustain growth, resources must be allocated to advancing technology and accumulating capital rather than to current consumption.
Jobs and Unemployment • Jobs • In 2006, 143 million people in the United States had jobs. • This number is 16 million more than in 1996 and 33 million more than in 1986. • But the pace of job creation fluctuates. • During the recession, the number of jobs shrinks. • During the 19901991 recession, more than 1 million jobs were lost and during the 2001 recession, 2 million jobs disappeared.
Jobs and Unemployment • Unemployment • Not everyone who wants a job can find one. • On an average day in a normal year, 7 million people in the United States are unemployed. • In a recession, the number is larger. For example, in 1990-1991 recession, 9 million people were looking for jobs. • The unemployment rate is the number of unemployed people expressed as a percentage of all the people who have jobs or are looking for one.
Jobs and Unemployment • The unemployment rate is not a perfect measure of the underutilization of labor. For two reasons: • The unemployment rate • 1. Excludes people who are so discouraged that they have given up looking for jobs. • 2. Measures unemployed people rather than unemployed labor hours. So it does not tells us about the number of part-time workers who want full-time jobs.
Jobs and Unemployment • Unemployment in in United States • Figure 20.6 shows the unemployment rate from 1926 to 2006.
Jobs and Unemployment • During the 1930s, the unemployment rate hit 25 percent.
Jobs and Unemployment • The lowest rate occurred during World War II at 1.2 percent.
Jobs and Unemployment • During recent recessions, the unemployment rate increased but was not as high as in the Great Depression.
Jobs and Unemployment • The unemployment rate is never zero. Since World War II, it has averaged 5 percent.
Jobs and Unemployment • Unemployment Around the World • Figure 20.7 compares the unemployment rate in the United States with those in Japan, Western Europe, and Canada. • The U.S. unemployment rate has been lower than that in Western Europe and Canada but higher than that in Japan.
Jobs and Unemployment • The cycle in unemployment in Canada is similar to that in the United States. • The cycle in unemployment in Western European is out of phase with that in the United States. • Unemployment in Japan has drifted upwards since the mid-1990s.
Jobs and Unemployment • Why Unemployment Is a Problem • Unemployment is a serious economic, social, and personal problem for two main reasons: • Lost production and incomes • Lost human capital • The loss of a job brings an immediate loss of income and production—a temporary problem. • A prolonged spell of unemployment can bring permanent damage through the loss of human capital.
Inflation and the Dollar • We measure the level of prices—the price level— as the average of the prices that people pay for all the goods and services that they buy. • The Consumer Price Index—the CPI—is a common measure of the price level. • We measure the inflation rate as the percentage change in the price level. • Inflation arises when the price level is rising persistently. • If the price level is falling, inflation is negative and we have deflation.
Inflation and the Dollar Inflation in the United States • Was low in the 1960s. • Increased in the 1970s and early 1980s. • Fell during the 1980s and 1990s. • Increased after 2002.
Inflation and the Dollar • Inflation Around the World • Figure 20.9(a) shows the inflation rate in the United States compared with that in other industrial countries. • U.S. inflation is similar to that in other industrial countries.
Inflation and the Dollar • Figure 20.9(b) shows the inflation rate in industrial countries has been much lower than that in developing countries.
Inflation and the Dollar • Hyperinflation • The most serious type of inflation is hyperinflation—an inflation rate that exceeds 50 percent a month. • Why Inflation is a Problem • Inflation is a problem for many reasons, but the main one is that once it takes hold, it is unpredictable. • Unpredictable inflation is a problem because it • Redistributes income and wealth • Diverts resources from production
Inflation and the Dollar • Unpredictable changes in the inflation rate redistribute income in arbitrary ways between employers and workers and between borrowers and lenders. • A high inflation rate is a problem because it diverts resources from productive activities to inflation forecasting. • From a social perspective, this waste of resources is a cost of inflation. • Eradicating inflation is costly because it brings a period of greater than average unemployment.
Inflation and the Dollar • The Value of the Dollar • The value of the U.S. dollar in terms of other currencies is called the exchange rate—a measure of how much your dollar will buy in other parts of the world. • An example is the number of pesos that 1 U.S. dollar will buy.
Surpluses, Deficits, and Debts • Figure 20.10 shows the U.S. dollar exchange rate. • When value of the dollar decreases, the U.S. dollar depreciates against other currencies. • When value of the dollar increases, the U.S. dollar appreciates against other currencies.
Inflation and the Dollar • Why the Exchange Rate Matters • When the U.S. dollar appreciates, U.S. consumers pay less for imported goods. • But the higher dollar makes it harder for U.S. producers to complete in foreign markets. A higher dollar hurts U.S producers. • When the U.S. dollar depreciates, U.S. consumers pay more for imported goods. So a lower dollar hurts consumers. • But the lower dollar makers it easier for U.S. producers to complete in foreign markets.
Surpluses, Deficits, and Debts • Government Budget Balance • If a government collects more in taxes than it spends, it has a government budget surplus. • If a government spends more than it collects in taxes, it has a government budget deficit.
Surpluses, Deficits, and Debts • Figure 20.11(a) shows the U.S. federal government budget balance from 1960 to 2005. • The budget deficit as a percentage of GDP increases in recessions and shrinks in expansions • In 1998, a budget surplus emerged, but the budget deficit reappeared in 2001.
Surpluses, Deficits, and Debts • International Surplus and Deficit • If a nation imports more than it exports, it has an international deficit. • If a nation exports more than it imports, it has an international surplus. • The balance on the current account equals U.S. exports minus U.S. imports but also takes into account interest payments paid to and received from the rest of the world.
Surpluses, Deficits, and Debts • Figure 20.11(b) shows the U.S. current account balance from 1960 to 2005. • During the 1980s expansion, a large deficit appeared but it almost disappeared during the 1990–1991 recession. • The current account deficit in 2005 was 6.3 percent of GDP.
Surpluses, Deficits, and Debts • Deficits Bring Debts • A debt is the amount that is owed. • When a government or a nation has a deficit, its debt grows. • A government’s or a nation’s debt equals the sum of all past deficits minus past surpluses. • A government’s debt is called national debt.
Surpluses, Deficits, and Debts • Figure 20.12(a) shows the U.S. government debt from 1945 to 2005. • Budget surpluses and rapid economic growth shrink the debt. • Budget deficits and slower economic growth swelled the debt.
Surpluses, Deficits, and Debts • Figure 20.12(b) shows the U.S. international debt from 1975 to 2005. • Until 1986, the United States was a net lender to the world. • But with increased deficits, the United States is now a net borrower from the world.
Macroeconomic Policy Challengesand Tools • Classical and Keynesian Views • Economists’ views fall into two broad schools: • Classical view: The economy behaves best if the government leaves people free to pursue their own self-interest. Attempts by the government to improve macroeconomic performance will not succeed. • Keynesian view: The economy behaves badly if left alone and that government action is needed to achieve and maintain full employment.
Macroeconomic Policy Challengesand Tools • Five widely agreed policy challenges for macroeconomics are to: 1. Boost economic growth 2. Keep inflation low 3. Stabilize the business cycle 4. Reduce unemployment 5. Reduce government and international deficits
Macroeconomic Policy Challengesand Tools • Two broad groups of macroeconomic policy tools are • Fiscal policy—making changes in tax rates and government spending • Monetary policy—changing interest rates and changing the amount of money in the economy • The government conducts fiscal policy. • The Federal Reserve (the Fed) conducts monetary policy.