Introduction to ArcView
Introduction to ArcView. NPS Introduction to GIS: Lecture 2 Based on NINC, ESRI and Other Sources. Learning Objective. To provide an introduction to the ArcView desktop GIS software package To help the user understand the terminology used. What is ArcView GIS?.

Introduction to ArcView
E N D
Presentation Transcript
Introduction toArcView NPS Introduction to GIS: Lecture 2 Based on NINC, ESRI and Other Sources
Learning Objective • To provide an introduction to the ArcView desktop GIS software package • To help the user understand the terminology used.
What is ArcView GIS? • It is a desktop Geographic Information System – a data base that links information to location (i.e., the what to where). • The Arcview user interface consists of windows that present information in different ways. Rows of menus, buttons, and tools at the top of the main application window allow the user to view and perform analytical operations on the data in the database.
Vector GIS Software • ArcView was initially developed as a data viewer. • Graphical User Interface & Open Source accessibility quickly won popularity • Current version is very robust; however, it still does not rival Arc/Info’s capabilities • Entirely window driven (no command line)
Menus, Buttons & Tools Located at the top of the main application window. Also known as the Graphical User Interface (GUI) Menu Bar Button Bar Tool Bar StatusBar
Detailed Overview • Documents / Projects • Views • Tables • Charts • Layouts • Scripts • Map Projections • ArcView Extensions
ArcView Projects ArcView projects are used to organize and store a collection of associated documents that work together during an ArcView session. Project information is stored in a project file. (.apr) The project window displays the names of all project documents.
ArcView Documents At the start of an ArcView session, the main GIS window contains an untitled Project window. Used to add/manage documents in a project. • Views • Tables • Charts • Layouts • Scripts Document Type Each project can have one or more documents of each type (e.g. tables)
Views • Displaycollections of geographic data files (themes), that cover the same geographic area • Provides an interactive map display • Contains a Table of Contents. Note: Each theme in the Table of Contents has a check box next to its name. If the box is checked, the theme is displayed. If it is not checked, the theme is not displayed. The user controls the theme displays – simply check or uncheck the box.
Conceptual Overview In ArcView geographic features can be: • Points • Lines • Polygons These features are stored in a database along with their feature attributes (i.e., descriptive information). These attributes are displayed in a spreadsheet format, called a Table. A GIS links sets of features (with their attributes), and manages them in units called themes. Themes are displayed as views.
View Example Buttons Tools Legend (Table of Contents) Map Display
Tables • Display tabular information in a spreadsheet type format • Formats data into records (rows) and fields (columns). • Each record represents a single feature and each field a single attribute for that feature. • Tables can be edited to add, change, or delete records and fields.
Charts • Provide a visual representation of a table • Graphically summarize information in tables • Allow you to interactively query tables • ArcView supports area, bar, column, line, pie and x,y scatter charts.
Layouts • Documents on which you can arrange views, tables, charts and images as graphic elements. • Used to compile a product (map) for printing and exporting. Note: Cartographic map components such as neatlines, north arrows, scale bars and legends can be placed on layouts.
Scripts • Used to customize almost any aspect of the standard ArcView interface • Written using the Avenue application development language Note: Avenue code is written in a Script editor document. The script editor allows you to create, modify, compile, execute, and debug Avenue script.
Organizational Hierarchy Projects (Can contain many views) Views (Display themes from many data sources) Themes (Use symbols to represent real-world features by points, lines or polygons)
ArcView Data Sources • Vector data (data that stores the location, shape and attributes of each feature) • Shapefiles (the ArcView format for storing location and attribute information for each feature). • ARC/INFO Coverages (in “coverage” format) • MapInfo Files • ARC/INFO’s raster data format (called a Grid) • Image Data • Tabular (matrix) data
Vector Data • A shapefile is the native ArcView format that is used for vector data • Each shapefile is a collection of files • Spatial data (shape geometry) .shp • Spatial data index .shx • Attribute data.dbf
Raster Data • ArcView themes (known as image themes) can be created from image data (e.g., satellite images, aerial photographs, scanned documents). • Image Themes do not have attribute tables. Can be manipulated by using the Image Legend editor. • ArcView supported image types: • - Erdas IMAGINE (with IMAGINE Image extension) • JPEG files (with JPEG extesion) • National Image Transfer Files (with NITF extension for military users) • Hot Linking to GIF & MacPaint • Other image types (BMP, BSQ, BIL, & BIP, MrSID, Image Catelogs, Sun rasterfiles, TIFF, GeoTIFF, & TIFF/LZW compressed
Matrix Data* • USGS DEM • Spatial Analyst or 3D Analyst Extensions • NIMA DTED • Spatial Analyst or 3D Analyst Extensions * ArcView Import
Creating Hot Links Can be linked to: • An image • An Avenue script • A Word document • A video application • The Web
Referencing Views to the Real World Requires a map projection – a formula that converts positional data (lat., long.) on an ellipsoidal surface to (x,y) coordinates on a planar surface.
Map Projections When Working with a View : • Original data must be in decimal degrees to be projected • Only the view of the data is changed, the source coordinates are unchanged • Projection units can be specified • Image and grid themes are unaffected by the projection properties specified for a view – they are assumed to be in the correct projection already. Always use the image/grid theme projection for the view!!
ArcView Extensions • Provide additional capabilities • User interface changes to reflect the additional capabilities • May be loaded and unloaded during a session • Will automatically load when required by an existing project
Optional Extensions • ArcView Spatial Analyst • Converts feature themes to grid themes • Contouring • Cell-based map analysis • ArcView Network Analyst • Efficient travel routing • Travel directions
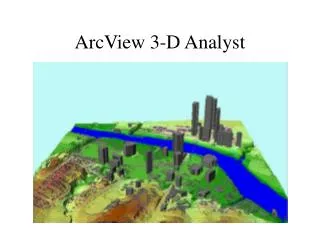
Optional Extensions • ArcView 3-D Analyst • Analyzing & displaying surface data. • TIN data models, 3D shapes, and interactive perspective viewing. • ArcView Image Analysis • Joint venture w/ERDAS • Basic Image Processing • Display, enhance, and analyze remotely sensed imagery
Summary • Documents / Projects • Views • Tables • Charts • Layouts • Scripts • Data Input • Using Projections • ArcView Extensions