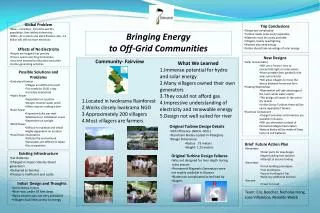
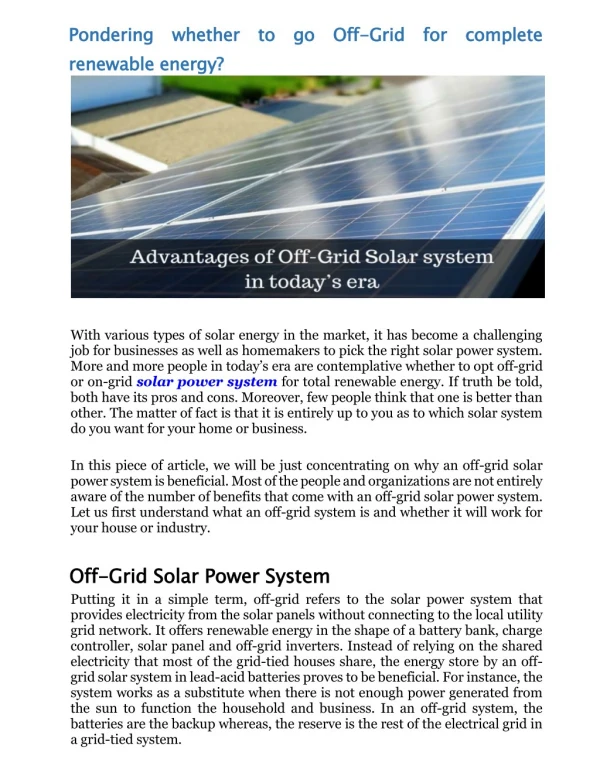
Off- grid Hybrid Renewable Energy System
Off- grid Hybrid Renewable Energy System. Hamad Jassim Rajab 200621000 Abdulrahman Kalbat 200608959 Buti Al Shamsi 200440143 Ahmed Al Khazraji 200620066. Department of Electrical Engineering. Graduation Project II Course Spring 2011. Outline. GPI Achievements

Off- grid Hybrid Renewable Energy System
E N D
Presentation Transcript
Off-gridHybridRenewableEnergy System Hamad Jassim Rajab 200621000 AbdulrahmanKalbat 200608959 Buti Al Shamsi 200440143 Ahmed Al Khazraji 200620066 Department of Electrical Engineering Graduation Project II Course Spring 2011
Outline • GPI Achievements • Modified Block Diagram • Design Constraints and Standards • HOMER Cases and Comparisons • Wind Turbine optimization • Maximum Power Point • Solar panel optimization • Solar Panel Shading Distance • Pyranometer • Anemometer • Data Acquisition Device (CompactRIO) • Expected Research Areas • Gantt Chart • Designed Poster • Achievements (WETEX 2011+ISSE)
GPI Achievements (1/6)Requirements, Specifications and Constraints • Requirements: Continuous power supply, relatively clean energy and low operating cost • Specifications: best installation location, backup availability and automatic switching • Constraints: limited financial support and area and meeting standards and regulations
GPI Achievements (3/6) Load Profile Total Load Demand = 26.1 kWh/day
GPI Achievements (4/6)Subsystem Sizing 1 wind turbine 24 solar panels 1 Variable Speed Diesel Generator 1 Bi-directional Inverter 24 Batteries 3 Charge Controller
GPI Achievements (5/6) HOMER Simulation • HOMER = Hybrid Optimization Model for Electric Renewables
GPI Achievements (6/6) HOMER Simulation • Main Inputs: • Preferred load profile • Actual Climatic Conditions in Al Ain city (Wind speed and Solar radiation) • Equipments sizes • Main Results: • Operation Cost (AED/Year) • Cost of Energy (AED/kWh) • CO2 Emissions (kg/year)
Design Constraints and StandardsBudget and Temperature • Limited Budget: 228,000 AED • Ambient temperature: • Average = 28.55 o C • Minimum = 5.3 o C ( in January ) • Maximum = 50 o C ( in June ) (From National Centre of Meteorology and Seismology in UAE )
Design Constraints and StandardsArea (1/3) Free Area = Total area – Used area = (25m X 38m) – (14m X 15m) = (950 m2) – (210 m2) = 740 m2
Design Constraints and StandardsArea (2/3) Solar Panels Considerations: • Maintenance spacing (dust removal) • Panel to panel distance according to NEC (avoiding shade)
Design Constraints and StandardsArea (3/3) Batteries Considerations: • Installed in a cabinet or not Battery rack Battery cabinet Battery Bank
Design Constraints and StandardsNoise Noise: • Threshold of pain = 130 dBA @ 10 meters • Equipment noise < Threshold of pain • Noise from diesel generator and wind turbine
HOMER Simulation (1/8)Case 1: Hybrid System: (5 kW Solar, 0.4 kW Wind, 7 kW Diesel) • Power Sources: 24 PVs, 1 Wind Turbine, 1 Diesel Generator • Load Sharing: 58% PV, 1% Wind, 41% Diesel • Cost of Energy: 2.9 AED/kWh • Operating Cost: 15,300 AED/yr • Shortage: 0% • CO2 Emissions: 6,119 kg/yr
HOMER Simulation (2/8)Case 1: Hybrid System: (5 kW Solar, 0.4 kW Wind, 7 kW Diesel)
HOMER Simulation (3/8)Case 2: Renewable Energy System: (5 kW Solar, 0.4 kW Wind) • Power Sources: 24 PVs, 1 Wind Turbine • Load Sharing: 98% PV and 2% Wind • Cost of Energy: 3 AED/kWh • Operating Cost: 9,920 AED/yr • Shortage: 36% • CO2 Emissions: 0 kg/yr
HOMER Simulation (4/8)Case 2: Renewable System: (5 kW Solar, 0.4 kW Wind)
HOMER Simulation (5/8)Case 3: Renewable Energy System: (17 kW Solar, 0.4 kW Wind) • Power Sources: 81 PVs, 1 Wind Turbine • Load Sharing: 99% PV and 1% Wind • Cost of Energy: 4.4 AED/kWh • Operating Cost: 13,780 AED/yr • Shortage: 0% • CO2 Emissions: 0 kg/yr
HOMER Simulation (6/8)Case 3: Renewable Energy System: (17 kW Solar, 0.4 kW Wind)
HOMER Simulation (7/8)Case 3: Diesel Generator: (7 kW Diesel Generator) • Power Sources: Diesel Generator ONLY • Load Sharing: 100% Generator • Cost of Energy: 3.8 AED/kWh • Shortage: 0% • Operating Cost: 34,000 AED/yr • CO2 Emissions: 25,433 kg/yr
Wind Turbine (1/2) Wind Turbine: • Average wind direction range = 339o to 6o Angles measured clock-wise from North
Wind Turbine (2/2) • Wind angle range: 27o • Wind turbine blades should head towards the indicated range.
Solar panel (1/11)Installation site coordinates Latitude: 24.2 N Longitude: 55.7 E
Maximum Power Point (1/4)Definition The point on the current-voltage (I-V) curve of a solar module under illumination, where the product of current and voltage is maximum (Pmax, measured in watts).
Maximum Power Point (4/4)I-V characteristic and PV Power I-V characteristic PV Power
Maximum Power Point (1/7)Definition The point on the current-voltage (I-V) curve of a solar module under illumination, where the product of current and voltage is maximum (Pmax, measured in watts).
Maximum Power Point (6/7)I-V characteristic Ideal Model Real Model
Maximum Power Point (7/7)PV Power Ideal Model Real Model
Solar panel (2/11)Seasons and sun’s locations • 1st day of spring/autumn = 90 – 24.2 = 65.8o above southern horizon • 1st day of winter = 65.8 – 23.5 = 42.3o above southern horizon • 1st day of summer = 65.8 + 23.5 = 89.3o above southern horizon
Solar panel (3/11)Seasons and sun’s locations • Summer (21 June - 23 September) = 89.3o to 65.8o • Autumn (23 September – 22 December) = 65.8o to 42.3o • Winter (22 December – 21 March) = 42.3o to 65.8o • Spring (21 March – 21 June) = 65.8o to 89.3o
Solar panel (4/11)Expected solar panel tilt angles Solar panel tilt (heading south) = 90 – sun location • Summer (21 June - 23 September) = 0.7o to 24.2o • Winter (22 December – 21 March) = 47.7o to 24.2o • Yearly yield = 24.2o
Solar panel (5/11)Solar panel tilt angles using PVSYST Software • Summer optimum tilt = 0o to 6o
Solar panel (6/11)Solar panel tilt angles using PVSYST Software • Winter optimum tilt = 43o to 46o
Solar panel (7/11)Solar panel tilt angles using PVSYST Software • Yearly yield optimum tilt = 21o to 24o
Solar panel (8/11)Solar panel tilt angles using case study Solar radiation Vs months of the year for different angles in Al Ain Winter Spring Summer Autumn
Solar panel (9/11)Solar panel tilt angles using case study Solar variation (10o) = 0.76 – 0.54 = 0.22 kW/m2 Solar variation (20o) = 0.77 – 0.6 = 0.17 kW/m2 Solar variation (30o) = 0.76 – 0.55 = 0.21 kW/m2 Optimum angle: around20o (maximum and stable solar radiation)
Solar panel (10/11)Factors affecting solar radiation 1) Angle of solar incident: • Best when perpendicular on the tilted plane • Maximum in 1st day of Spring and Autumn Maximum points Winter Spring Summer Autumn
Solar panel (11/11)Factors affecting solar radiation 2) Length of the day: • In polar regions, 6 months of daylight. • Highest solar radiation in the first day of summer (24 hours daylight) Drop during summer ?
Solar Panel Shading distance (3/10) Solar Panel Dimensions Length = 1.652 m Width = 0.994 m mm mm
Solar Panel Shading distance (4/10) Sun path in Al Ain