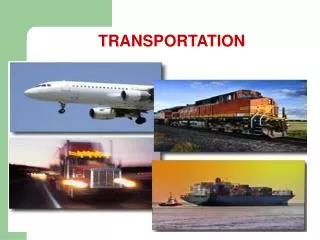
Transportation
Transportation. Michal Hyrc , Eric Tidquist , William Koury & Ryan Henderson. Objectives. To better understand the carbon footprint of transportation at Washington University by: Ground Transportation: Improving Past Estimates Air Travel: Novel Estimates

Transportation
E N D
Presentation Transcript
Transportation Michal Hyrc, Eric Tidquist, William Koury & Ryan Henderson
Objectives • To better understand the carbon footprint of transportation at Washington University by: • Ground Transportation: Improving Past Estimates • Air Travel: Novel Estimates • Parking: What happens when we go underground?
Approach & Methodology Flying • Extracted student locations and numbers from home zip code data • Found total passenger miles flown by students • Estimated carbon footprint from total number of passenger miles Parking • Used approximate appliance data to estimate daily carbon emissions • Used approximate size data to estimate initial carbon emission due to pouring concrete Commuting • Used school zip code data from a similar project conducted in 2009 • Calculated commuting distances by mode of transportation • Walk/Bike • MetroLink • MetroBus • Drive Alone • Carpool • Estimated carbon footprint • Upper bound • Lower bound • Best guess
Ground Transportation Faculty Addresses Student Addresses
Modes of Transportation and Total Carbon The two upper charts represent the number of students (left) and faculty (right) that commute to school in each mode of transportation taken into consideration. The chart to the right represents the total carbon emissions from students and faculty. Best guess total: 5627 metric tons of CO2
Summary & Conclusions • Our best estimates for annual transportation footprints are • ~23,000 metric tons of CO2 from student air commute • ~5,500 metric tons of CO2 from faculty and student regional ground commute • ~527 metric tons of CO2 from lighting and ventilation of parking on campus • This is an underestimation of the actual total footprint • The transportation footprint has been and will continue to increase • To reduce the transportation footprint, we recommend the University • Merge fall and thanksgiving break to reduce flight emissions • Try to reduce the number of people that drive to work by themselves
References • http://hypertextbook.com/facts/1999/KatrinaJones.shtml • http://apps.olin.wustl.edu/mba/casecompetition/PDF/oscc_case2.pdf • http://www.engineeringtoolbox.com/garage-ventilation-d_1017.html • http://www.docstoc.com/docs/2392070/Overview-of-Existing-Regulations-for-Ventilation-Requirements-of/ • http://www.epa.gov/ttnchie1/conference/ei13/ghg/hanle.pdf • http://capitawiki.wustl.edu/EECE449/index.php/Commuting • http://capitawiki.wustl.edu/EECE449/index.php/Shuttles • http://capitawiki.wustl.edu/EECE449/index.php/Transportation • http://www.bts.gov/xml/air_traffic/src/index.xml#CustomizeTable • http://www.ghgprotocol.org/ • http://www.eia.doe.gov/oiaf/1605/coefficients.html • http://www.whatsmycarbonfootprint.com/faq.htm • http://www.carbonfund.org/site/pages/carbon_calculators/category/Assumptions • http://www.epa.gov/oms/climate/420f05001.htm • http://capitawiki.wustl.edu/EECE449/index.php/Transportation