Download
1 / 79
790 likes | 942 Vues
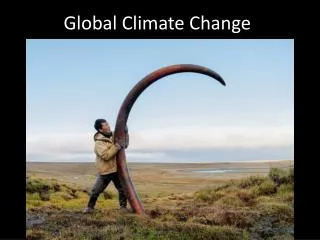
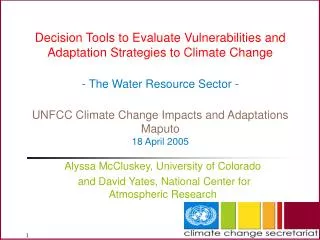
Climate Change in the Great Lakes Region. Starting a Public Discussion. Tonight: Climate Change and Potential Impacts on Wisconsin’s Lakes, Streams and Groundwater. www.seagrant.wisc.edu/ClimateChange. or…Why are lake levels so low?. Tim Asplund Wisconsin Dept of Natural Resources.

E N D
Climate Change in the Great Lakes Region Starting a Public Discussion Tonight:Climate Change and Potential Impacts on Wisconsin’s Lakes, Streams and Groundwater www.seagrant.wisc.edu/ClimateChange
or…Why are lake levels so low? Tim Asplund Wisconsin Dept of Natural Resources
F. Koshere “small lake”, Burnett County
F. Koshere Tomahawk Lake, Bayfield County
Below normal 7-day avg. streamflow (Aug. 2, 2007) http://water.usgs.gov/waterwatch/
Anvil Lake Stage Record (1936 – 2006) Source: USGS Source: USGS Some lakes are dropping over the long term
Anvil Lake Shell Lake Devils Lake But remember this? Shell Lake (WI) June 2002 Krohelski 2003
Shell Lake Stage Record (1936 – 2006) Source: USGS
Devil’s Lake Stage Record (1935-2006) 1935 1970 2005 Source: USGS
Step Increase in Lake Stage, Stream Flow, and Groundwater Levels after 1970 Groundwater Well Lake Stage Stream Flow Shell Lake Gray = step increase Red = no step increase Devils Lake USGS Data Magnuson et al. 2003
Which one is the future? Maybe both!
Presentation overview • Climate Change evidence • Projections for Wisconsin • Impacts to water resources • Understanding water levels • Case Studies • Putting it all together • What to do?
Climate Change in the Great Lakes Region: Starting a Public Discussion • Global Warming Is Unequivocal: • The recent IPCC report has clearly stated that “warming of the climate system is unequivocal” and it is “very likely” caused by human activities. • Moreover, most of the observed changes are now simulated by models over the past 50 years, adding confidence to future projections. Trenberth, 2007
Variation in Earth Surface Temperatures Northern Hemisphere - last 1000 years Departure in Temperature (C°) from the 1961 to 1990 average IPCC 2007
Greenhouse Gas Concentrations Radiative Forcing (Wper m2) Atmospheric Concentrations IPCC 2007
Simulated Annual Mean Surface Air Temperatures Natural and Anthropogenic Forcing Observed Natural Forcing Alone IPCC 2007
Temperature Change in IPCC Scenarios 7.2°F 3.2°F IPCC 2007
Evidence of Climate Change in the Great Lakes Region* • Temperatures are rising, especially in winter. • Extreme rainfall events (24-hr and 7-day) are becoming more frequent. • Winters have become shorter. • Spring is coming earlier. • Duration of ice cover is shorter, especially on smaller lakes. Source; Edge of the Wilderness Scenic Byways *http://www.ucsusa.org/greatlakes
Projected Climate Changes in the Great Lakes Region by 2100 • Temperature • Winter 5-12 °F (3-7 °C) • Summer 5-20 °F (3-11 °C) • Extreme heat more common • Growing season several weeks longer • Precipitation • Winter, spring increasing • Summer, fall decreasing • Drier soils, more droughts • More extreme events – storms, floods • Could be 50-100% more frequent than now • Ice cover decline will continue Source: Bob Allan, NREL UCS/ESA 2003
+80 +40 0 -40 +80 +40 0 -40 Winter High Emission Observed Observed and projected change in average daily precipitation (%) Low Emission Summer Low Emission Observed High Emission 1900 2000 2100 Magnuson April 2001 UCS/ESA 2003
Moving States - Going to Arkansas? UCS/ESA2003
Wisconsin Air Temperatures 1895-2005 Notice Change Annual Mean Air Temperature (F) Increase 0.7 F/decade Increase 0.04 F/decade Magnuson: Data from State Climatology Office
What happened to precipitationin Wisconsin? Median = 30.2 in.Median = 33.2 in. Annual Total (inches) Fall 50% Summer 30% Winter 17% Spring 3% Magnuson 2006: Data from Wisconsin State Climatology Office
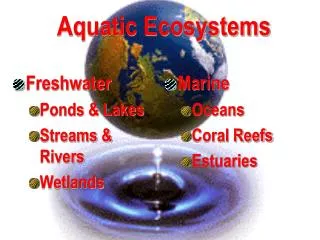
Climate change impacts on water resources • Decreased ice duration on inland lakes and rivers • Changes in species distributions (natives and exotics) • Impacts to water quality of lakes, streams, rivers, and wetlands • Altered hydrologic regimes at watershed scale (more extremes)
Changes in the Hydrologic Cycle Krohelski 2003
Projected Precipitation Changes in the Great Lakes Region (by 2070-99) • Doubling of heavy precipitation events • Seasonal shifts in precipitation -- * More rain in winter and spring (planting season) * Less rain during the summer and fall growing seasons UCS/ESA 2003
Rainfall Intensity • Certain processes of the surface water balance are heavily influenced by rainfall intensity • The rate of percolation of water into the soil is limited • As rainfall intensity increases, soil moisture recharge tends to decrease and runoff tends to increase Source: Kunkel, ISWS
Water Levels – Scenario #1 • Shorter duration of ice cover will increase evaporation in winter • Warmer air temperatures will increase evapotranspiration • Lower precipitation in summer will decrease soil moisture • Lakes may go down SOURCE: UCS/ESA 2003
Water Levels – Scenario #2 • Warmer, wetter winters • Enriched CO2 in atmosphere increases water use efficiency and increases runoff AND infiltration • Long-term trend may be increased baseflow and groundwater levels • Lakes may go up Source: John Magnuson, 2007
Factors affecting lake water levels • Lake morphology and hydrology • Landscape position • Natural variability (weather) • Short term drought (and wet) cycles • Climate change • Human water use (i.e. pumping)
Lake Hydrology Fig 2.3 Magnuson et al. 2006
Groundwater Discharge • Natural Lake • Water Source • Groundwater • Precipitation • Limited Runoff • May have springs • Has Stream Outlet
Water levels vary naturally Source: USGS Circular 1186
Natural variability “A statistical analysis of data in table 1 indicates that 9 out of 10 natural lakes in the State will fluctuate within the following approximate ranges during periods of 20 years or longer.” Source: USGS/WGNHS, “WI Lake Levels”
Landscape Position Magnuson et al. 2006
Response of Lakes to Drought Fig 3.2 Magnuson et al. 2006
Are we in a drought now? State Climatology Office http://www.aos.wisc.edu/~sco/
Step Increase in Lake Stage, Stream Flow, and Groundwater Levels after 1970 Groundwater Well Lake Stage Stream Flow Baseflow Anvil Lake Shell Lake Gray = step increase Red = no step increase Devils Lake USGS Data Magnuson et al. 2003
Source: WGNHS