
Population – all items of interest. Example: All vehicles made In 2004.
Parameter – numerical summary of the entire population . Example: population mean fuel economy (MPG). Population – all items of interest. Example: All vehicles made In 2004. Sample – a few items from the population. Example: 36 vehicles. Statistic – numerical

Population – all items of interest. Example: All vehicles made In 2004.
E N D
Presentation Transcript
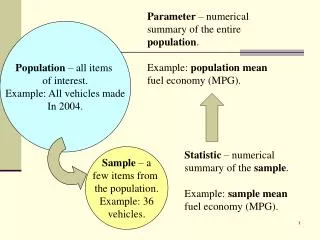
Parameter – numerical summary of the entire population. Example: population mean fuel economy (MPG). Population – all items of interest. Example: All vehicles made In 2004. Sample – a few items from the population. Example: 36 vehicles. Statistic – numerical summary of the sample. Example: sample mean fuel economy (MPG).
Interpretation – Part 1 • The population mean fuel economy for cars and trucks made in 2004 could be any value between 21.05 mpg and 22.98 mpg. • This locates the center of the distribution.
Interpretation – Part 2 • We are 95% confident that intervals based on random samples from the population with capture the actual population mean. • This is confidence in the process.
What is confidence? http://statweb.calpoly.edu/chance/applets/ConfSim/ConfSim.html
Testing Hypotheses • Do cars and trucks made in 2004 meet the CAFE standard of 24 mpg, on average?
Step 3 - Decision • Reject the null hypothesis because the P-value is so small (smaller than 0.05).
Step 4 – Conclusion • Based on our sample data, cars and trucks in 2004 did not meet the CAFE standard or 24 mpg, on average.
CI versus Testing • Note that our CI is consistent with our test of hypothesis. • CI indicates plausible values are between 21.05 and 22.98 mpg. • 24 is not a plausible value!
Statistical Inference • So far we have found plausible values for the population mean value and discovered that 24 is not the value of the population mean.
What about one vehicle? • Individual vehicles will have fuel economies different from the mean. • How can we quantify the variation we might expect to see in an individual vehicle?
Interpretation • I am 95% confident that a vehicle chosen at random from those made in 2004 will have a fuel economy between 16.15 mpg and 27.87 mpg