Download
1 / 25
250 likes | 386 Vues
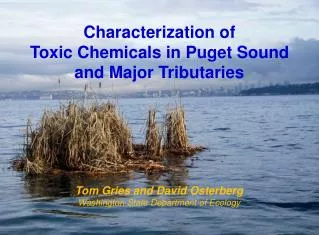
Toxic Chemicals in Puget Sound and Major Tributaries. Tom Gries and David Osterberg Washington State Department of Ecology. Introduction. Puget Sound Toxics Loading Analysis Compiled relevant information, estimated loads, identified data gaps

E N D
Toxic Chemicals in Puget Sound and Major Tributaries Tom Gries and David Osterberg Washington State Department of Ecology
Introduction • Puget Sound Toxics Loading Analysis • Compiled relevant information, estimated loads, identified data gaps • Developed box model for transport and fate of toxic chemicals(Poster session 10D) • Estimated loading after land use-based water quality monitoring in two watersheds(Wed 6A) • Estimated loading from ocean exchange and from monitoring near mouths of major rivers • Synthesis(Platform session 1A)
Goals • Provide concentration data for toxic chemicals entering Puget Sound • To reduce uncertainty of outputs from Puget Sound Toxics Box Model → • Provide concentration data for toxic chemicals in Puget Sound • To calibrate the Box Model
Objectives • Measure concentrations of toxics in: • Surface and deep waters of Puget Sound basins and ocean boundary waters • Five largest tributaries to Puget Sound • Suspended particulate matter (SPM) at the same marine and freshwater sites • Evaluate spatial and temporal variability in concentrations • Calculate loads
Sampling Design: Marine Waters • 7 stations representingBox Model cells andmain ocean boundary • 2 depths per station • 3 seasons: summer, fall, and winter
Results: Marine Water Column • TSS, organic carbon, and metals similar to other studies; most organics seldom detected • POC, total zinc, and PBDEs most variable • Total PCBs < recent Canadian study • Total PBDEs often 10X Canadian study
Results: Spatial Variability • DOC, copper, lead, PCBs: PS > OB • Cadmium: ocean boundary > Puget Sound
Results: Spatial Variability • Deep > Surface • Arsenic, total lead • Total PCBs → • Surface > Deep • DOC in ocean boundary waters
Results: Ocean Exchange • Boundaries • Admiralty Inlet • Deception Pass • 2-layer circulation • Deep water flows into Puget Sound • Surface water flows out of Puget Sound • Net exchange = Mass exported – Mass imported • Mass exported = volume out x flow-weighted concentrations of surface layer at Main, Whidbey and Hood Canal basin sites • Mass imported = volume into Puget Sound x concentrations of deep layer at Haro Strait and San Juan de Fuca sites
Results: Ocean Exchange • Based on model-predicted water fluxes and25th-75th percentile concentrations … • Most parameters exported • Cadmium and lead imported
Sampling Design: Marine SPM • Sediment traps • Five sites and 1-2 depths • Represented Box Model boundaries / cells • From Nov ‘09 – Jan ‘10
Results: Marine SPM • Only recovered deep Hood Canal traps ! • Analyzed SPM from ‘08 South Sound traps • Gross sedimentation < urban embayments • Chemical fluxes in Hood Canal < in South Sound (except copper) • Rates can be compared to Box Model-predicted sedimentation losses
Conclusions: Marine Waters • Detected parameters found in low concentrations • Organic carbon, metals, and PCB concentrations similar to other studies • Semivolatile organics, PAHs, and chlorinated pesticides seldom detected • PCBs greater in Puget Sound and at depth • PBDE concentrations relatively high and variable • Most parameters likely exported out of Puget Sound (cadmium imported) • Sedimentary flux of toxics associated with SPM in Hood Canal less than in more developed basins
Sampling Design – 5 Rivers • Depth-integrated samples at 3 quarter points in channel • Surface grabs for petroleum-related compounds
Conclusions - Rivers • Concentrations of most detectable parameters low and similar to other studies • Petroleum-related compounds, BNAs and chlorinated pesticides seldom detected • Organics detected more often in SPM • Some spatial and temporal differences • Most measured daily loads within ranges estimated from monitoring studies
Summary • Low detection frequency for many organic compounds in marine and river water • When detected, concentrations of toxics in marine and river water generally low • Concentrations in Puget Sound often greater than in ocean boundary waters • Concentrations in deep layers often greater than in surface layers • Net export of toxic chemicals out of Puget Sound, except cadmium and lead
Summary (continued) • Sedimentation and flux of toxic chemicals greater in basins with more developed watersheds • Concentrations of conventionals, nutrients, and metals in river water similar to other studies • Marine and river water results improve choice of input values for the Puget Sound Box Model and ability to calibrate it • Organic chemicals more likely to be detected in SPM than in water samples
Recommendations • To improve estimates of external loading: • Sample more intensively near model boundaries and measure concentrations of most variable toxics (PBDEs) • Sample more frequently (especially during storm-related flows) and analyze fewer chemicals • To improve detection frequency of nonpolar organic compounds, focus future sampling on collection/analysis of SPM
Recommendations • Skim through report:http://www.ecy.wa.gov/biblio/1103008.html
Acknowledgments Ecology staff: Bruce Barbour, Julia Bos, Randy Coots, Karin Feddersen, Mya Keyzers, Stuart Magoon, Jim Maroncelli, Dean Momohara, Dale Norton, Greg Pelletier, Brian Pickering, Mindy Roberts, Nancy Rosenbower, Dave Serdar, Janice Sloan, John Weakland, Leon Weiks, Jeff Westerlund
Parameters Measured • Metals (dissolved and total arsenic, cadmium, copper, lead, and zinc) • Organic compounds (33 chlorinated pesticides, 55 semivolatile organics, 22 PAHs, 209 PCB congeners, 26 PBDE congeners) • Conventional parameters (total suspended solids, dissolved and total organic carbon) • Nutrients (nitrogen and phosphorus), hardness, and petroleum-related compounds (TPH and oil and grease) in river water only
Results: Marine Water Column • Total PCB Concentrations • Range 6.9-75.1 pg/L (mean = 26.3 pg/L) • Puget Sound (30.7 pg/L) > Ocean Boundary (20.4 pg/L) • Ocean boundary < Dangerfield et al, 2007 (42 pg/L) • Deep layer (32.7 pg/L) > surface layer (15.1 pg/L) • Total PBDEs • Detection frequency <25% • Range 50-19,000 pg/L (mean = 2900 pg/L) • Measured concentrations highly variable • 6/10 detections and two highest concentrations from ocean boundary sites • Results often 10X greater than Dangerfield et al study
River SPM Results • Detection frequency 20% for petroleum-related compounds, semivolatile organics, and chlorinated pesticides • 16 of 22 PAHs measured routinely detected in SPM with 30-210 µg/Kg TPAH (mean = 120 µg/Kg) • Mean PCBs = 410 ng/Kg • Mean PBDEs = 1700 ng/Kg