Age Distribution and Test Sensitivity Analysis of Dogs for Canine Viral Diseases
This study presents an analysis of the age distribution of tested dogs, revealing key insights into their susceptibility to Canine Parvovirus (CPV), Canine Distemper Virus (CDV), and Infectious Canine Hepatitis (ICH). Data demonstrate expected proportions of false negatives and positives, emphasizing the importance of vaccine sensitivity and specificity in assessing canine health. The relationship between test scores and age is explored, indicating varying immunity levels among different age groups. This information aids in understanding the true prevalence of unprotected dogs and their risk for viral infections.

Age Distribution and Test Sensitivity Analysis of Dogs for Canine Viral Diseases
E N D
Presentation Transcript
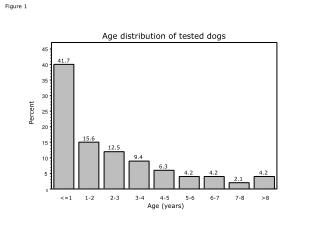
Figure 1 Age distribution of tested dogs 45 41.7 40 35 30 Percent 25 20 15.6 15 12.5 9.4 10 6.3 4.2 4.2 4.2 5 2.1 0 <=1 1-2 2-3 3-4 4-5 5-6 6-7 7-8 >8 Age (years)
Figure 2 Expected proportions of false negatives and false positives 6.0 4.0 5.5 3.5 5.0 3.0 ICH–specificity = 87 % 4.5 2.5 CDV & ICH-sensitivity = 95 % Proportion of false positives (%) Specificity Sensitivity Sensitivity Proportion of false negatives (%) 4.0 2.0 3.5 1.5 3.0 1.0 2.5 0.5 CPV-sensitivity = 97 % 2.0 0.0 75 80 85 90 95 100 True prevalence of protected dogs (%)
Figure 3 Distribution of scores for the level of immunity (N = 322 dogs) 60 60 60 a) b) c) 55 55 55 Protected 50 50 50 No 45 45 45 Yes 40 40 40 35 35 35 Percent 30 30 30 25 25 25 20 20 20 15 15 15 10 10 10 5 5 5 0 0 0 Score 0 1 2 3 4 5 6 0 1 2 3 4 5 6 0 1 2 3 4 5 6 Canine Parvovirus Canine Distemper Virus Infectious Canine Hepatitis
Figure 4 Comparison of scores in the first and the second test (N = 74 dogs) 80 80 80 a) b) c) 75 75 75 Tests 70 70 70 First 65 65 65 60 60 60 Second 55 55 55 50 50 50 Score<3 in 2nd test: 8.1 % Score<3 in 2nd test: 6.8 % Score<3 in 2nd test: 18.9 % 45 45 45 40 40 40 Percent 35 35 35 30 30 30 25 25 25 20 20 20 15 15 15 10 10 10 5 5 5 0 0 0 Test 1 2 1 2 1 2 1 2 1 2 1 2 1 2 1 2 1 2 1 2 1 2 1 2 Score 3 4 5 6 3 4 5 6 3 4 5 6 Canine Parvovirus Canine Distemper Virus Infectious Canine Hepatitis
Figure 5 Difference in scores between first and second test (2nd – 1th) 60 60 60 a) b) c) 55 55 55 Scores 50 50 50 Lower in 2nd test 45 45 45 Unchanged 40 40 40 Higher in 2nd test 35 35 35 Percent 30 30 30 25 25 25 20 20 20 15 15 15 10 10 10 5 5 5 0 0 0 Diff. -4 -3 -2 -1 0 1 2 -4 -3 -2 -1 0 1 2 -4 -3 -2 -1 0 1 2 Canine Parvovirus Canine Distemper Virus Infectious Canine Hepatitis
Figure 6 Relationships between difference in scores between 1th and 2nd test (2nd – 1th) 4 4 4 a) b) c) 3 3 3 1 4 2 1 1 1 1 2 2 2 1 4 3 7 2 3 1 1 1 1 1 2 6 22 1 7 13 1 2 2 11 4 2 0 0 0 CDV Difference (2nd – 1th) ICH Difference (2nd – 1th) ICH Difference (2nd – 1th) 1 2 4 12 1 1 6 14 2 1 6 13 1 2 -1 -1 -1 1 3 1 2 2 2 7 1 6 3 2 1 -2 -2 -2 1 1 1 2 1 1 1 1 1 1 3 -3 -3 -3 1 2 1 1 -4 -4 -4 -4 -3 -2 -1 0 1 2 3 4 -4 -3 -2 -1 0 1 2 3 4 -4 -3 -2 -1 0 1 2 3 4 CPV Difference (2nd – 1th) CPV Difference (2nd – 1th) CDV Difference (2nd – 1th)
Figure 7 Predicted probability of test score < 3 as a function of age 0.25 0.20 Maximum Likelihood Estimates CPV: α = - 0.40 (p = 0.001); β = - 1.18 (p < 0.001) 0.15 CDV: α = - 0.19 (p = 0.025); β = - 1.48 (p < 0.001) ICH: α = - 0.26 (p = 0.002); β = - 1.12 (p < 0.001) Predicted probability 0.10 0.05 0.00 0 1 2 3 4 5 6 7 8 9 10 11 12 13 14 Age (years)
Figure 8 Estimated true prevalence of unprotected dogs as a function of age 25 20 Legend Specificity+Pr(T+)-100 p = 100 - CPV Sensitivity+Specificity-100 15 CDV p = Estim. True prev. of unprotected Pr(T+) = Prop. tested protected Estimated true prevalence (%) ICH 10 5 0 0 1 2 3 4 5 6 7 8 9 10 11 12 13 14 Age (years)