Chapter 9 Comparing Means
Chapter 9 Comparing Means. Comparing Two Means. Most of the time we want to compare two different populations Males vs. Females Students who use SAT study program vs. students who do not use SAT study programs What do we do?. Comparing Two Means. μ 1 = mean of first population

Chapter 9 Comparing Means
E N D
Presentation Transcript
Comparing Two Means • Most of the time we want to compare two different populations • Males vs. Females • Students who use SAT study program vs. students who do not use SAT study programs • What do we do?
Comparing Two Means • μ1 = mean of first population • μ2 = mean of second population • Interested in the quantity μ1 - μ2 • These are unknown parameters • Take samples from each group and estimate the quantity with
Testing Difference in Means • σ1 and σ2 are parameters (use when n ≥ 30) • Replace with s1 and s2 (use when n < 30) • Changes distribution (goes from z to t)
Testing Difference in Means • The standardized sample difference between the means of two independent groups (aka the test statistic) is
Hypothesis Test for μ1 - μ2 • Step 1: • Hypotheses • HA: μ1 - μ2 > 0 (m1 > m2) • HA: μ1 - μ2 < 0 (m1 < m2) • HA: μ1 - μ2≠ 0 (m1≠m2) • Step 2: • Alpha Level (assume .05)
Hypothesis Test for μ1 - μ2 • Step 3: • Model is Normal • Step 4 • Test statistic:
Hypothesis Test for μ1 - μ2 • Step 5: • Decision: • Reject HO when p-value is smaller than α • Do not reject HO p-value is larger than α • Step 6: • Conclusion • Always stated in terms of Ha in the problem.
HT Example Difference in Means • In June 2002, the Journal of Applied Psychology reported on a study that examined whether the content of TV shows influenced the ability of viewers to recall brand names of items featured in commercials. Researchers randomly assigned 108 volunteers to watch a program with violent content and 108 to watch a program with neutral content. Both programs featured the same 9 commercials. After the shows ended, subjects were asked to recall the brands in the commercials. Is there evidence that viewer memory for ads is less than zero? Use α = 0.05.
HT Example Difference in Means • Step 1: • μ1 = mean number of brands recalled for violent program group. • μ2 = mean number of brands recalled for neutral program group. • HO: μ1 - μ2 ≥ 0 • HA: μ1 - μ2 < 0
HT Example Difference in Means • Step 2: • Alpha Level: α=0.05 • Step 3: • Normal
HT Example Difference in Means • Step 4: • Test statistic:
HT Example Difference in Means • Step 4 (cont.): • P-value = P(z < -4.399) = way less than 0.001
HT Example Difference in Means • Step 5: • Decision: Since p-value < α = 0.05, we will reject the null hypothesis. • Step 6: • Conclusion: The mean number of brands recalled by the neutral program group is different than the mean number of brands recalled by the violent program group. Type of program affects the recall of brands from commercials.
Independent vs. Dependent Samples • We would like to determine if students taking an ACT prep course will score better than students not taking the course. A random sample of 25 students was chosen who took the course and a random sample of another 25 students was chosen who did not take the course. At the end of the prep course, both groups were given the ACT.
Independent vs. Dependent Samples • Group #1 – score on ACT from students taking prep course • Group #2 – score on ACT from students NOT taking prep course • Observations taken from two independent samples
Independent vs. Dependent Samples • We would like to determine if students can improve their ACT score by taking a prep course. A random sample of 25 students was chosen. They first took the ACT test. Then they spent 6 weeks taking the prep course. At the end of the 6 weeks, they took the ACT test again.
Independent vs. Dependent Samples • Group #1 – score on ACT before prep course • Group #2 – score on ACT after prep course • Two observations taken for each subject
Important Difference • If the values come from: • two independent samples • use inference for (μ1 – μ2) = difference in means for two groups • dependent samples (e.g. values collected twice from same subject) • use inference for μd = mean difference between two values • The second situation is called Matched Pairs
Inference for μd • d = pairwise difference • Confidence Interval • Hypothesis Test (degrees of freedom = n-1)
Pairwise Differences • ACT Prep Course: Does the course improve scores?
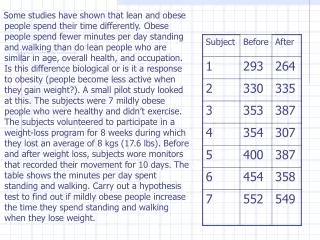
Matched Pairs Hypothesis Test Example • Measure effectiveness of exercise program in lowering blood cholesterol levels • SRS of men from a population • Measure cholesterol before program starts • Go through exercise program for 12 weeks • Measure cholesterol after program ends • Is the exercise program effective?
Matched Pairs Hypothesis TestExample • Two observations from each subject • Post value depends on pre value • Observations are dependent • Do not have independent samples • Cannot use inference for μ1 - μ2 • Violates independent samples assumption
Matched Pairs Hypothesis Test Example - Data • Look at pre-program levels minus post-program levels
Matched Pairs • Because it is the differences we are interested in, we will treat them as the data and ignore the original two groups. • A matched pairs t-test is just a one-sample t-test (from Chapter 23) for the mean of the pairwise differences.
Matched Pairs Hypothesis Test Example • Let μd = mean difference in cholesterol levels in population • Sample mean difference is • Sample standard deviation of differences is sd = 17.99 • n = number of differences = 10
Matched Pairs Hypothesis Test Example • If exercise program has no effect, mean difference will be 0 • If exercise program is effective, mean difference will be positive • Step 1: • HO: μd = 0 • HA: μd > 0
Matched Pairs Hypothesis Test Example • Step 2: • Alpha Level (default=.05) • Step 3: • Model: • t9
Matched Pairs Hypothesis Test Example • Step 4: • Test statistic:
Matched Pairs Hypothesis Test Example • Step 4 (cont.): • P-value = P(t9 > 1.42) = between 0.05 and 0.10
Matched Pairs Hypothesis Test Example • Step 5: • Decision: Since p-value > 0.05 = α, we will fail to reject the null hypothesis. • Step 6: • Conclusion: There is no evidence that the exercise program reduced the mean cholesterol level of men in this population.
Matched Pairs Confidence Interval Example • For a random sample of 12 European cities, the average high temperatures in January and July are given on the following slide. • Find a 90% confidence interval for the mean temperature difference between summer and winter in Europe. Assume the Nearly Normal assumption is satisfied.
Matched Pairs Confidence Interval Example • I am 90% sure that the true mean difference is between 32.33 and 41.31.
Difference in Proportions • Hypotheses • HA: p1 - p2 > 0 • HA: p1 - p2 < 0 • HA: p1 - p2≠ 0 • Test Statistic On the calculator use 2PropZTest
HT Difference in Proportions • A sample of 200 teenagers shows that 50 believe that war is inevitable, and a sample of 300 people over age 60 shows that 93 believe war is inevitable. Is the proportion of teenagers who believe war is inevitable different from the proportion of people over 60 who do ? Use α = 0.01.
HT - Difference in Proportions • Step 1 • HO: p1 - p2= 0 • HA: p1 - p2≠ 0 • Step 2 • α = 0.01 • Step 3 • Normal
HT - Difference in Proportions • Step 4 • Step 5 • Do Not Reject • Step 6 • There is not enough evidence to suggest that p1 - p2≠ 0.
Difference in Variance/Std. Dev. • Hypotheses • HA: σ12 – σ22 > 0 • HA: σ12 – σ22 < 0 • HA: σ12 – σ22≠ 0 • Use σ if testing standard deviation • Test Statistic • The larger variance is always in the numerator • d.f.N = (n1 – 1) d.f.D = (n2 -1)
HT - Difference Between Std. Dev. • A researcher claims that the standard deviation of the ages of cats is smaller than the standard deviation of the ages of dogs who are owned by families in a large city. A randomly selected sample of 29 cats has a standard deviation of 2.7 years, and a random sample of 16 dogs has a standard deviation 3.5 years. Using α = 0.05 test the researchers claim.
HT - Difference Between Std. Dev. • Dogs have the higher s.d. so they are s1 and the test is that cats’ s.d. is smaller • Step 1 • HO: σ12 – σ22 ≤ 0 • HA: σ12 – σ22 > 0 • Step 2 • α = 0.05
HT - Difference Between Std. Dev. • Step 3 • F(15, 28) • Step 4 - use 2-sampFtest on calculator
HT - Difference Between Std. Dev. • Step 5 • 0.114 > 0.05 • Do Not Reject Ho • Step 6 • There is not enough evidence to suggest σ12 – σ22 > 0.