Download
1 / 88
880 likes | 1.07k Vues
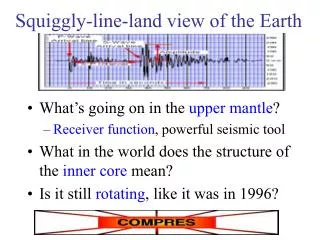
Squiggly-line-land view of the Earth. What’s going on in the upper mantle ? Receiver function , powerful seismic tool What in the world does the structure of the inner core mean? Is it still rotating , like it was in 1996?. Outline of mantle discussion. (I just got a digital camera).

E N D
Squiggly-line-land view of the Earth • What’s going on in the upper mantle? • Receiver function, powerful seismic tool • What in the world does the structure of the inner core mean? • Is it still rotating, like it was in 1996?
Outline of mantle discussion (I just got a digital camera) • USArray • Receiver function analysis • MOMA • Africa • RISTRA • The upper mantle discontinuities • Water at 410-km-depth • A double “520”
EarthScope Components • EarthScope's facilities include the following four coupled components: • USArray (United States Seismic Array) • SAFOD (San Andreas Fault Observatory at Depth) • PBO (Plate Boundary Observatory) • InSAR (Interferometric Synthetic Aperture Radar)
Why look at the upper mantle? • Mapping seismic structure • P & S velocity, density, anisotropy • To deduce physical characteristics • Chemical and thermal heterogeneity • To deduce what’s going on • Stagnant or moving continental keels • Dynamics of upper thermal boundary layer of the mantle • Mantle circulation
Seismic-style study • Reflection for crustal structure • S-wave splitting for anisotropy • Flow direction - aesthenosphere • Relic fabric - lithosphere • Surface and body wave tomography • Absolute velocities in upper few 100 km • Body wave tomography (deeper) • Receiver functions • Best resolution of radial velocity gradients
The receiver function • Pioneered by seismologists including Bob Phinney and Chuck Langston • Examines echoes of the P wave to determine zones of high radial gradient in seismic velocity • It is proving to be a very useful companion to seismic tomography, providing detailed pictures of near-receiver structure
Chuck Langston, after igniting 50 pounds of explosives in sand
Ray paths contributing to receiver functions Chuck Ammon
Radial component of receiver function Just useful for finding the Moho
Lateral variations Adam Alan
Mechanics of a receiver function • Extract the P wave from the vertical component • Deconvolve it from the horizontal component • This should leave a spike at the P arrival time and a string of P-S conversions • Convert the conversions (as a fcn of time and ground motion) to structure (impedance as a function of depth) • Average together the records from many distances and azimuths
Some limitations • Assumes no lateral variations in structure • Migration can overcome this limitation • Only works in a frequency pass band • Cannot recover baseline, trends, or really much beyond about 100-200 km wavelength velocity structure • Generally falls apart shorter than 5-10 km wavelengths
MOMA • Missouri to Massachusetts transect • 19 stations placed every 100 km • Chosen for nice graphics Mike Wysession Keith Koper
MOMAdiscontinuity imaging Mike Wysession Karen Fischer
Stereo vision Receiver functions from events to the north East!? West Events to the south
Tomography plus receiver functions T < 150° C Disagreement with individual profiles Farallon depression?
Shows trend of smaller time separation with more vertical incidence Gao, GRL, 2002
Again, well-resolved reflections from near 410 and 660 Note the presence of clear 410 conversions at short-period
Thicker transition zone to NE Transition thickness near global average of 245 km, so not cold under region, 10 km of relief may correspond to ~60° temperature difference cooler warmer
Receiver function migration • Just like migrating seismic reflection data • Benefits from adequate spatial sampling • Ability to image structure depends on • Depth of structure • Frequency of waves recorded • Of course, more events with more back-azimuths, and more distances are helpful
Resolution with 70 km spacing T= 15s
Resolution with 10 km spacing T= 2s
MOMA migration MOMA Array: Depth Migration LP10s
XD SS CB GF Moho Moho SLAB Cheyenne Belt Receiver Functions Imbricated Moho Mantle layered Archean Mantle Modified Proterozoic Mantle Fast from tomography From Ken Dueker
RISTRA Rio Grande Rift Ran from Texas into Utah Rick Aster Receiver functions across the 1000-km line give a good picture of the shallow structure, and show little topography on the 410 and 660. moho
Ken Dueker Hot off the JGR “press” • Hersh, Dueker, Sheehan, and Molnar, JGR • 410 and 660 topography under western US • 20-30 km topography, with 500 km scale length • No relation to surface tectonics • Sharpness not easily related to depth • Conclusions: • Either transition zone has smaller scale convection than deep mantle • Or there is a lot of compositional variation down there
Anne Sheehan Field area
Average receiver function structure Seymour Hersh 410 660
410 topography +/- 10 km 660 topography +/- 15 km
Science 6 June 2003 Seismic evidence for water deep in the Earth’s upper mantle Federica Marone Mark van der Meijde Domenico Suzanne van der Lee
Science 6 June 2003 - van der Meijde et al. 1000 ppm water broadening the 410-km-discontinuity?
Main points of van der Meijde • Conversion from “410” stronger at low frequency than high, but conversion from “660” is steady • So “410” must be broader, in fact very broad, 20-40 km wide • Subduction has been pervasive, so water might be common near 410-km-depth • Entire story is consistent if about 1000 ppm water is present.
~1 s period 6 s period
9 stations The general trend is consistent, and statistics can be constructed to support the significance of the trend.
The phase P’P’ Jim Whitomb DLA
JGR, Fei, Vidale and Earle • Rounded 3 good datasets of P’P’ • California networks • LASA recordings • Highly selected GSN seismograms • We’ll see • Sharp 660-km-depth discontinuity • Somewhat less sharp 410, sometimes • (but MUCH sharper 410 than claimed for Europe) • No 520