Connecting Scientific Research Projects and Data Through Software
120 likes | 138 Vues
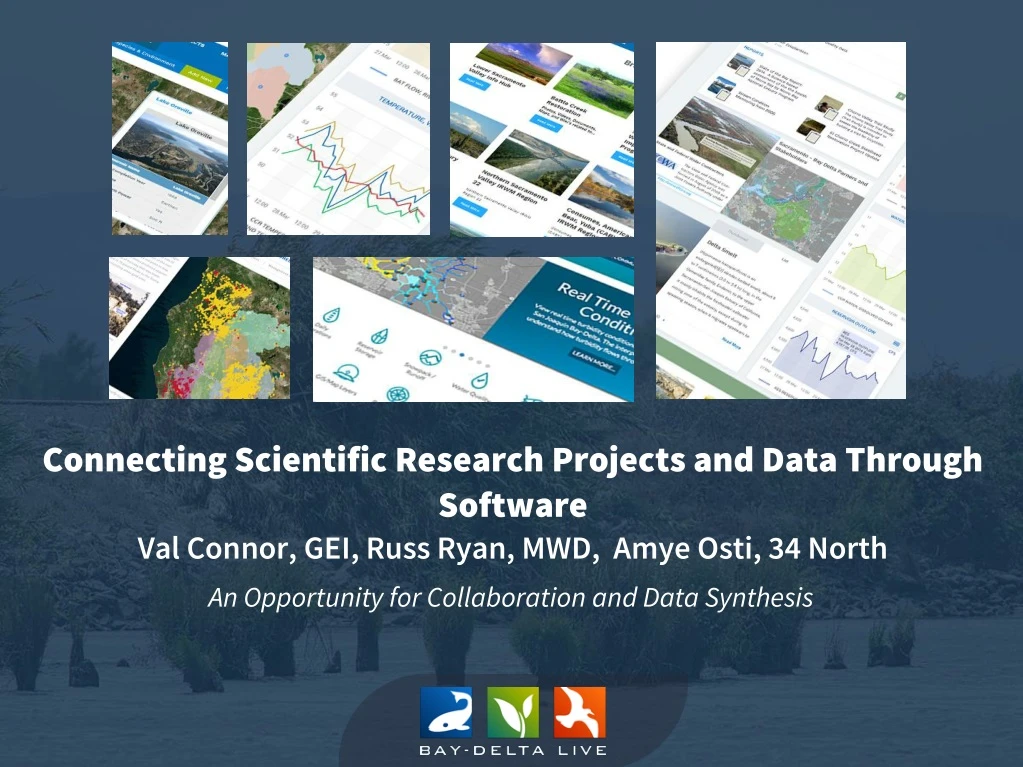
An opportunity for collaboration and data synthesis among major data providers in hydrologic, water quality, satellite, meteorological, and terrestrial research. This collaborative effort aims to aggregate data from stakeholders throughout the region and provide access to regional and statewide programs through software platforms.

Connecting Scientific Research Projects and Data Through Software
E N D
Presentation Transcript
Connecting Scientific Research Projects and Data Through Software Val Connor, GEI, Russ Ryan, MWD, Amye Osti, 34 North An Opportunity for Collaboration and Data Synthesis
Major Data Providers Data is aggregated from stakeholders throughout the region: Hydrologic Water Quality Satellite Meteorological Terrestrial Volunteer Sampling
A Collaborative Effort Regional and Statewide Programs SACRAMENTO SAN JOAQUIN BAY-DELTA SWRCB MY WATER QUALITY PORTALS CALIFORNIA ESTUARY PORTAL SAN JOAQUIN REAL TIME MANAGEMENT DWR 1641 WATER QUALITY SACRAMENTO RIVER WATERSHED
OpenNRM Estuary Portal Fisheries Dashboards WARMF Modeling SRWP Monitoring Programs 1641 Reporting DOSS and DCT Real Time Management Forest Health and Fire BDL Ca Estuaries Cache Collaborative DSM2 Modeling Compliance Monitoring SJRRTM Ecosystem Restoration SRWP EMP Monitoring Real Time Operations Reporting Dashboards Region Data Hubs State Estuaries Template By the Numbers Collaborative Management Temperature Compliance OPEN NRM Research Projects Data Tools
BayDeltaLive DWR Environmental Monitoring Program Report
Cache Collaborative Info Hub Regional data sets, GIS, Maps, Documents, Images, Reports and Current Conditions
By The Numbers Delta Conditions Reporting for the DSC
Salinity www.baydeltalive.com/salinity
Turbidity Conditions Turbidity Model displays real-time data from 46 CDEC Stations. View data at various intervals (15 min, 1 r, 6 hr, 12 hr, 1 day, 1 week, 1 mo, 1 yr). Data is 15-minute and averaged based on interval.
Data Dashboards and Stories Fisheries, Reservoir Conditions, Water Quality
Operations Decision Management CALFED Operations Smelt Working Group (SWG) Water Operations Management Team (WOMT) Delta Conditions Team (DCT) Delta Operations For Salmon and Sturgeon (DOSS)
What Types of Information Do Managers Consider? Meteorological Forecasts Sediment Surveys Carcass Surveys Juvenile Monitoring Data Fish Production Seine Data Water Quality Weir Counts Biotelemetry Data Redd Surveys Reservoir Inflow Modeling Outputs Genetic Analysis Trawl Data Salvage Stream Guage Data Salmon Escapement Reservoir Release Schedules