Download
1 / 22
220 likes | 465 Vues
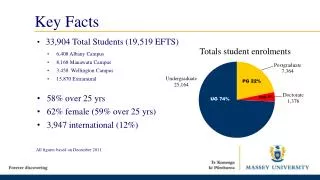
Amtrak Key Facts Summary November 12, 2007. Basic Amtrak Facts. Serves 21,100 route-miles in 46 states, serving 525 stations FY 07 ridership was 25.8 million, up 6.4% from FY 06 FY 07 ticket revenues were $1.519 billion, up 10.8% from FY 06

E N D
Basic Amtrak Facts • Serves 21,100 route-miles in 46 states, serving 525 stations • FY 07 ridership was 25.8 million, up 6.4% from FY 06 • FY 07 ticket revenues were $1.519 billion, up 10.8% from FY 06 • FY 07 systemwide on-time performance was 68.6% - a 0.8% increase • Acela OTP was 87.8% • Regional OTP was 78.0%
Basic NEC Facts • Extends 457 miles between Washington, DC and Boston • Amtrak owns 363 route-miles (1,219 track miles) of the Corridor • Metro North owns and operates 56 miles of the NEC north of New York City • Massachusetts owns the last 38 miles to Boston, but Amtrak maintains and operates it • Corridor hosts 1,900 trains per day • 1,700 commuter trains per day • 158 Amtrak trains per day • About 50 freights • 1,200 daily movements into and out of Penn Station in New York
Top Ten Corridors Corridor Ridership Length Change from FY06 Frequencies NEC 10,035,012 457 mi +6.4% 158 Surfliner 2,707,188 128 mi +1.9% 25 (SD-SLO) Capitol 1,450,069 133 mi +14.8% 32 (SJ-Sacramento) Keystone 988,454 104 mi +20.1% 29 Empire 957,583 141 mi +4.3% 24 San Joaquin 804,785 318 mi +0.6% 12 Cascades 674,153 187 mi +7.4% 12 Hiawatha 595,336 86 mi +2.6% 14 Wolverine 449,107 281 mi +2.4% 8 Chicago-St Louis 408,807 187 mi +55.8% 10 Green highlight indicates corridor is also one of the ten fastest-growing corridors Frequency indicates approximate daily schedule (based on timetable and A Report)
Top Ten Corridors by Growth Corridor Change from FY06 Length Ridership Frequency Chicago-Carbondale +67.4% 310mi 228,695 6 Chicago-St. Louis +55.8% 284mi 408,807 10 Chicago-Quincy +41.4% 258mi 169,258 6 Chicago-Indianapolis +31.1% 196mi 26,347 2 Keystone +20.1% 104mi 988,454 29 Vermonter +16.6% 611mi 63,299 2 Capitol Corridor +14.8% 120mi 1,450,069 32 Adirondack +7.5% 381mi 101,097 2 Cascades +7.4% 467mi 674,153 12 Downeaster +7.0% 116 mi 361,634 8 Green highlight indicates increases in service frequency - frequencies include long distance trains, where appropriate
September FY07 Ridership & Ticket Revenues Actuals • Systemwide ticket revenues for September FY07 were $124.4 million (+10% vs last year and +4% vs Budget) on the strength of the NEC. Total ridership in September was 2.1 million trips (+8% vs last year and +4% vs Budget); • Acela ticket revenues in September were +18% vs FY06 and +14% vs Budget. Ridership was +12% vs FY06 and +7% vs Budget. Acela continues to benefit from faster run-times, more northend departures, improved OTP, and poor air competition… • Regional ridership was +5% vs last year and +2% vs Budget. Regional ticket revenues were +9% vs last year and +8% vs Budget. Despite increased competition from some low-cost airlines (jetBlue, Southwest), Regionals continue to grow based on 1) a good service/value proposition; 2) diverted car trips; and 3) diverted air trips from legacy carriers; • September 07 long distance ticket revenues were +4% vs FY06 and -1% vs Budget. Ridership and ticket revenues on most long distance trains exceeded FY06 levels; • Ridership on other corridor trains was +11% vs FY06 and +1% vs Budget. Ticket revenues were +10% vs FY06, but -6% vs Budget. Poor on-time performance – evidenced by weak CSI scores – combined with higher Amtrak fares and declining gas prices may be limiting growth opportunities.
FY07 Summary • Amtrak: Total ridership was +6% vs last year and nearly +3% vs Budget. Ticket revenues were +11% vs last year, and +4% (+$54.9 million) vs Budget due primarily to Acela. Other corridor trains grew vs FY06, but fell short of Budget; • Acela: Ridership and ticket revenues are very strong -- far ahead of last year and Budget due to the combined benefits of an improved service (faster by 5 minutes on the southend, improved OTP, and more northend service frequency) and increasingly poor air competition; • Regional: Ticket revenues were +7% vs last year and 2% favorable to Budget. Ridership was +1% vs year ago and +3% vs Budget; • Long Distance: Ridership and ticket revenues ended favorable vs Budget and year ago due to fare increases in Fall FY07 as well as deferral of most planned LD sleeper equipment reductions. Long Distance OTP ran 12 points higher FY07 vs FY06, resulting in higher CSI scores among customers; • Other Corridors: Ridership and ticket revenues in FY07 finished ahead of last year due in part to additional trains in the east (Keystones), the mid-west (all 3 Illinois routes), and the west (Capitols and Cascades), although most other corridors (the ones w/o service expansions) were also favorable vs FY06. Ridership performance vs FY07 Budget was unfavorable by about 1%. OTP remains an issue on many corridors.
Ridership and Revenue Revenue Yield Per Passenger Mile Ridership Growth Riders Fiscal Year Fiscal Year Ticket Revenue NOTE: All years restated to reflect NJ Transit assumption of NJ/NY Clocker trains in FY05. Dollars Fiscal Year
Acela OTP Source: Operations
Regional Service OTP Source: Operations
Keystone Service OTP Source: Operations
Other State Corridor OTP Source: Operations
Long Distance OTP Source: Operations
South End Air/Rail Shares (NYC-DC) Source: Air-Rail Shares Report
North End Air/Rail Shares (Boston-NYC) Source: Air-Rail Shares Report
Workforce Employee headcount Fiscal Year
Corporate Debt Fiscal Year
Federal support for operations Fiscal Year NOTE: Financial adjustments in FY01 included losses which should have been included in FY00.
State commitment to rail service Fiscal Year