Download
1 / 12
120 likes | 279 Vues
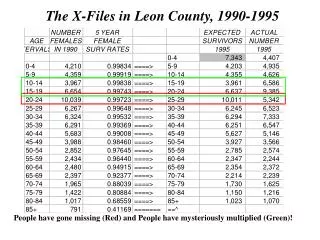
The X-Files in Leon County, 1990-1995. People have gone missing (Red) and People have mysteriously multiplied (Green)!. The Migration Component. Migration is the most important, volatile, and difficult factor to be considered in preparing small area population projections.

E N D
The X-Files in Leon County, 1990-1995 People have gone missing (Red) and People have mysteriously multiplied (Green)!
The Migration Component • Migration is the most important, volatile, and difficult factor to be considered in preparing small area population projections. • Migration is tied to age, sex, and race making it even more complicated. In addition, migration varies greatly with local conditions and is impacted by local and national policies. • Unfortunately, there is no single, comprehensive source of migration data in this country. • Sources for Migration data include: 1) Decennial Census (Q: Residence five years ago) 2) IRS data: State to State, County to County migration flows (Review of Income Tax returns) 3) Current Population Survey (CPS) (Qs on Migration) • However, despite the utility of the above data sets, migration is often incorporated into CC models via a “residual analysis”.
Migration and Residual Analysis • Residual analysis is a method for computing historic migration rates, one that compares observed and expected populations. The method utilized is called the “survival rate method”. • Pop T2 = Pop T1 + Births - Deaths +/- Net Migration Net Migration = (Pop T2 – Pop T1) - (B - D) • So for an individual Age-Sex CohortM10-14 in 1995 = (M5-9 1990 * SR) + In Migrants – Out Migrants • so, NM = M10-14 1995 - (M5-9 1990 * SR) • Net migration is assumed to be the residual population change that cannot be accounted for by the natural processes. • These migration rates can then be analyzed, adjusted as necessary, and then applied to future time periods. • This method requires 1) accurate vital statistics (OK) and 2) accurate population counts (maybe a problem) Net Migration
Limitations to the Net Migration Approach • Despite its widespread use, the net migration approach has several key limitations: 1) Still a naïve approach: Past migration rates are expected to predict future migration rates 2) Violation of the at-risk principle: By combining inmigration and outmigration we make people already living in the county “at-risk” for inmigration, which is a logical inconsistency. 3) Long run errors: The net migration approach makes growing places grow faster and declining places decline faster. We will talk about ways to overcome these problems in a later class.
Cohort-Component Reminders • Reminder #1You need at least one set of historical data to complete the technique. For example, if you want to project for 2010 and 2020, you would look at historical data from 1990-2000. • The convention is to use a few historical periods so that any shorter term migration, mortality, and fertility trends can be “smoothed out”. • Reminder #2To be completed correctly, the Cohort-Component Technique needs to proceed generally in the following order. To determine historic rates 1) Mortality 2) Fertility 3) Migration To determine future impacts 1) Mortality 2) Migration 3) Fertility • Reminder #3The model assumes that past Mortality, Fertility, and Migration rates will continue into the future. However, these can be (and should be) altered if there is evidence that this will reflect local trends more closely.
The Cohort-Component Method Continued • The CC Method allows you to project populations at intervals equal to the length of the age cohorts. (5 year cohorts, 5 year projections; 10 year cohorts, 10 year projections) • Other advantages of the method: --Can analyze components of population change independentl --Can analyze the age-sex-race cohorts to identify trends --Method takes into account special populations • Projection Series--As with the ratio techniques, the convention with CC is to produce Low, Medium, and High projection series. This is done by adjusting the Mortality, Fertility, and Migration Rates up or down. --In addition, the US Census Bureau produces L/M/H Mortality and Fertility projections that can be used to produce the different projection series.
The Cohort-Component Method Summarized • There are no Input evaluations for this method, but you could use the MAPE and ME. • In addition, Cohort Component Projections can be analyzed by comparing the projections with the region’s observed trends through analyzing the following outputs: • 1) Total Population 2) Total population by age-sex-race cohorts 3) Number of live births and deaths by cohort 4) Mortality/Survival and Birth rates by cohort 5) Net migration rates by cohort • By comparing the results of the projection to past trends any anomalies can be identified. Plotting rates over time is one good way to insure that the CC projections make sense. • Population pyramids for the observed and projected populations are another way to insure that the projections make sense.