Download
1 / 133
1.41k likes | 1.79k Vues
The DMAIC Lean Six Sigma Project and Team Tools Approach Improve Phase. Six Sigma Improve Phase. “The starting point for improvement is to recognize the need.” - Imai. Improve - Introduction. Lean Six Sigma Black Belt Training! Improve Agenda.

E N D
The DMAIC Lean Six Sigma Project and Team Tools Approach Improve Phase
Six Sigma Improve Phase “The starting point for improvement is to recognize the need.” - Imai Improve - Introduction
Lean Six Sigma Black Belt Training! Improve Agenda Welcome Back and brief D M A Review Improve Overview Generate and Prioritize Solutions Risk Assessments Evaluate Solutions Approach for Implementation Translate Improvements for Communication Other Improvement Approaches and Support Design for Six Sigma Designed Experiments Applications / Lessons Learned / Conclusions Next Steps
Improve Phase Review: Key Steps In alignment with our project goal statement, and given what we have learned in the Define, Measure, and Analyze Phases of our project, during the Improve phase our team will complete: Generating and prioritizing Solutions (Improvement actions) Risk assessment Evaluation of Solutions and Benefits Approach for Implementation Translating and communicating learnings to Champion and Process Owner(s) as appropriate We will define and implement GREAT improvement solutions! Improve – Key Deliverables
Lean Six Sigma DMAIC Phase Objectives • Define… what needs to be improved and why • Measure…what is the current state/performance level and potential causes • Analyze…collect data and test to determine significant contributing causes • Improve…identify and implement improvements for the significant causes • Control…hold the gains of the improved process and monitor
What is Six Sigma? A high performance measure of excellence A metric for quality A business philosophy to improve customer satisfaction Focuses on processes and customers Delivers results that matter for all key stakeholders A tool for eliminating process variation Structured methodology to reduce defects Enables cultural change, it is transformational
The Lean Six Sigma Approach • Lean Six Sigma is the combination of the Lean and Six Sigma “tool boxes” to create a customer-centric, value-based philosophy and rapid-fire deployment of focused methodologies to transform our business processes to be able to consistently deliver bottom line results that are sustainable and continuously improved. Design for Six Sigma
Six Sigma applied effectively… Increases customer satisfaction Lowers costs Builds better leaders Empowers an organization to be more data-driven
The Basic Philosophy of Lean Six Sigma • All processes have variation and waste • All variation and waste has causes • Typically only a few causes are significant • To the degree that those causes can be understood they can be controlled • Designs must be robust to the effects of the remaining process variation • This is true for products, processes, information transfer, transactions, everything • Uncontrolled variation and waste is the enemy
The basic focus of Six Sigma Therefore, to understand the output (results) we are getting, we must study and understand the process and inputs that go into producing the output we are getting. Y = f(Xs) …data-driven problem solving and continuous improvement
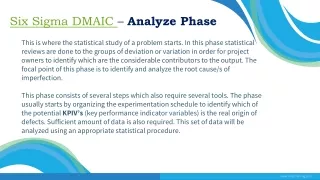
Six Sigma DMAIC Projects Analyze Phase What does the process data reveal? What are the Critical Key Xs? How much variation in “Y” from the Key “Xs”? What “Xs” can be and need to be improved (Root Causes)?
x x x x x x x Y=f(x) Process MappingParetoC&E Matrix, FishboneFMEASIPOC Capability StudyMeasurement Systems Analysis X's Measure Phase15-70 xs Pareto Chart, Correlation/Regression Hypothesis Tests, ANOVA, Descriptive Statistics, t-tests, Proportions Analyze Phase7-15 xs Prioritization Matrix, Improvement Ideas, C&E Matrix, Future State Map, PDSA Improve Phase 3-7 xs Control Plans, SOPs, SPC, Mistake Proofing Control Phase 3 or fewer xs Only the Critical Xs need to be monitored and controlled long term
Six Sigma Improve Phase (pg. 14 -16) TheImprove Phase is a systematic approach for examining the identified key xs, and determining, testing, and implementing the best solution(s). • What changes can we make that will result in a • sustainable improvement in the process output? • How will we know that a change has resulted in • an improvement in the process output? Improve – Introduction
Six Sigma Improve Phase (pg. 14 -16) Through process analysis, you will generate andtestrobustsolutionsshown to affect the proven causes (xs) that affect the critical output (Y) in a positive manner. The result will be an improved process that is stable,predictable, and one that consistently meets customer requirements. Improve – Introduction
The (Rational) Improvement Alternative to Downward Spiralling Improve to Six Sigma performance levels Budget Lids/Hiring Freezes Across-the-board cuts Eliminate chronicproblems Programs eliminated Eliminate non-value-added work Consolidation of units Eliminate waste / rework Downsizing/Restructuring Improve – Introduction
New and Improved Technology and Training could be the most robust solution, but always remember to: “Reach for the mind before you reach for the wallet” - borrowed Improve Phase: Technology and Training - Right? Improve – Introduction
The Default Solutions… Training & education New technology Working harder or faster More inspection or auditing New policies More people working in a broken process …Are not always the rightsolutions! Improve – Introduction
Why People Don’t Do What They Are Expected To Do (Robert Mager) They don’t know how to do it. They don’t know what’s expected of them. They don’t have the authority to do it. They don’t get timely information about how well they are doing. (In other words, they don’t get feedback.) Their information sources (documentation) are poorly designed, inaccessible, or nonexistent. Improve – Introduction
Why People Don’t Do What They Are Expected To Do (Cont’d) They don’t have job aids to cue correct performance. Their work stations provide obstacles to desired performance. The organizational structure makes performing difficult. They are punished or ignored for doing things right. Improve – Introduction
Why People Don’t Do What They Are Expected To Do (Cont’d) They’re rewarded for doing things wrong. Nobody ever notices whether they perform correctly or not. Have we addressed each of these previous 11 concerns as to why people don’t do what they are supposed to do through our Improvement and Control actions? Improve – Introduction
Data-Driven Problem Solving To be successful with any Six Sigma project, you have to affect at least one of the following: Reduce Variation Shift the Mean Eliminate Outliers
LSL USL LSL USL LSL USL Characteristic of the Performance Gap… (Problem) Accuracy and/or Precision Off-Target Variation On-Target Center Process Reduce Spread LSL = Lower spec limit USL = Upper spec limit The statistical approach to problem solving
4σ 5σ 6σ 3σ 2σ 1σ Long-Term Yield vs Process Sigma 100% 3.4 DPMO 233 DPMO 6,210 DPMO Long-term Yield 66,807 DPMO 90% 80% 70% 308,537 DPMO 60% 50% 40% 30% 690,000 DPMO 20% 10% 0% 0 2 4 3 6 1 5 Process Sigma
Six Sigma ImproveImproving the identified Key Xs to Improve the Process (Y) and the Customer’s Experience
Key Deliverables for Improve Main elements of Define, Measure, and Analyze completed “Obvious Xs” identified and confirmed Potential Xs identified, data collected and confirmed (Root Causes) Improvement solutions generated and prioritized upon investigation of root causes and supported with data Improve – Review & Key Deliverables
Key Deliverables for Improve Improvement solutions tested (pilot) and benefits estimated Implementation plan for solution(s) drafted with input from process owners Champion approval of the key solution(s) implementation Improve – Review & Key Deliverables
Six Sigma Improve Phase “I know of no more encouraging fact than the unquestionable ability of mankind to elevate his life through a conscience endeavor.” - Henry David Thoreau
Improve Phase Review: Key Steps In alignment with our project goal statement, and given what we have learned in the Define, Measure, and Analyze Phases of our project, during the Improve phase our team will complete: Generating and prioritizing Solutions (Improvement actions) Risk assessment Evaluation of Solutions and Benefits Approach for Implementation Translating and communicating learnings to Champion and Process Owner(s) as appropriate Improve – Review & Key Deliverables
Improve Phase: Generate Solutions The objective is to generate ideas - come up with ways to impact our key xs in a way that will lead to an improved, consistent output. Be creative, find “out-of-the-box” solutions, invent potential fixes, and find ways to optimize your process. There are many ways of generating ideas. Here are four of the most common and useful: Brainstorming Affinity Diagrams (using key xs) Process Mapping (current v. future) Best practices/benchmarking Improve – Generate Solutions
Improve Phase: Generate Solutions – Brainstorming(pg 27-29) A question or statement about an identified key x that negatively impacts Y is written on a board or flip chart for the entire team to see. Creative thinking is used as team members suggest potential improvements for the stated x. All ideas are recorded without any judgment initially of their validity. “Out of the box” thinking is strongly encouraged here, and “spring-boarding” off of others ideas is powerful. Think beyond the “status quo” or self imposed rules from the culture of the organization. Improve – Generate Solutions
Improve Phase: Generate Solutions Brainstorming Questions to Consider Where is the process step done? Can it be done elsewhere? Who performs the step? Can someone else perform the step? When is the step performed? Can the timing be changed? Under what conditions is the step performed? Can the conditions be changed? What resources are required for the process step? Where else can resources be found? What else can be used? How is the process step controlled? Is it value - adding? What does the customer really need? How is the customer using the process output - product or service? Improve – Generate Solutions
Brainstorming Guidelines Clarify the question being considered Go around to each member asking for input, but also allow ideas to be written down - as on a sticky note, etc. Do not make any critical comments about initial ideas submitted by team members - only ask for clarification if needed Strive for a high quantity of ideas to begin with, then move toward “quality” Improve – Generate Solutions
Improve Phase: Generate Solutions - Affinity Diagrams(pg 30-31) An Affinity Diagram is used to help a team discover meaningful groups of ideas or relationships within a raw list of ideas - as coming potentially from a brainstorming session. Affinity diagrams are helpful when: facts or thoughts are uncertain and need to be organized preexisting ideas or paradigms need to be overcome ideas need to be clarified unity within a team needs to be strengthened Improve – Generate Solutions
Improve Phase: Generate Solutions - Affinity Diagrams To create an affinity diagram, the team sorts a brainstormed list, moving ideas from the raw list into affinity sets, creating groups of related ideas. This can easily be done by writing on a flipchart, or using post-it notes to “re-stick” into affinity groups. Basic guidelines for affinity diagrams: Rapidly group ideas together that seem to belong together Clarify any ideas in question Initially, it isn’t important to define why they belong together Copy an idea into more than one affinity set if appropriate Seek to summarize or name each set with appropriate titles and this may lead to more robust improvement ideas / actions Improve – Generate Solutions
Improve Phase: Process Mapping(pg. 34-41) A process is a sequence of steps or activities using inputs to produce an output (accomplish a given task). A process mapis a visual tool that documents a process. Several styles and varying levels of detail are used in Process Mapping. Most common and useful styles are SIPOC, Flow Diagrams, Box Step, andValue Stream Maps. Improve – Generate Solutions
Improve Phase: Process Mapping The team should start with the observed, current, as-is process. Start high-level, and work to the level of detail necessary for your project (key inputs). As inconsistencies are discovered, the team can develop a future state or should-be process map to improve the key xs and the overall output (Y) of the process. Improve – Generate Solutions
Analyze Roadmap: Process AnalysisTypes of Process Delays or Errors: Gaps Redundancies Implicit or unclear requirements Bottlenecks Hand-offs Conflicting objectives Common problem areas
Improve Phase: Process Mapping for Process Improvement True “process improvements” usually DON’T come from: - working harder using a broken or inefficient process - education or re-education - blaming / threatening / coercion / policies Consider: - making changes that “make it easy to do it right” - hardwire in desired defaults - eliminate process steps that don’t add value - if you have too much variation or “special cause”, designing a consistent process should be your first step to improvement Langley, et. al. “The Improvement Guide - A practical Approach to Enhancing Organizational Performance”. Improve – Generate Solutions
Improve Phase: Generate Solutions - Best Practices / Benchmarking (pg. 254-255) Benchmarking is measuring your process performance against other “best in class” similar processes internally and / or externally as appropriate. Adopt the process steps and parameters as appropriate to obtain the desired output results from your own process. “Best practices are a sustainable competitive advantage. It’s true that, once a best practice is out there, everybody can imitate it, but organizations that win do two things: they imitate and improve it.” - Jack Welch Improve – Generate Solutions
Improve Phase: Prioritize Solutions Once you have a set of potential solutions, your team will need to narrow down your list by identifying the best solutions to test. You will need to consider a number of factors: impact, cost, resources, etc. Multivoting Prioritization matrix Improve – Prioritize Solutions
Improve Phase: Prioritize Solutions – Multivoting(pg 31-32) Multivoting narrows a large list of possibilities to a smaller list of the top priorities or to a final selection. Multivoting is preferable to straight up or down voting because it allows an item that is favored by all, but not the top choice of any, to rise to the top. Usually follows brainstorming or affinity diagramming to prioritize the main ideas. Improve – Prioritize Solutions
Improve Phase: Prioritize Solutions - Multivoting To conduct the multivoting process, the team works from a brainstormed list of ideas, options, etc. This can easily be done by writing on a flipchart, marker board, or using post-it notes. Each team member will have a marker, or self-adhesive dots to use for voting. The number of multiple votes each member gets depends on the size of the list, but it is usually about one third of the total number of items on the list. Basic guidelines for multivoting: All team members get an equal number of votes A member can distribute their votes or cast all of them for one idea If two or three ideas are close in voting, then a multivote can occur with those two or three ideas listed Improve – Prioritize Solutions
Improve Phase: Prioritize Solutions - Prioritization Matrix A prioritization matrix is used to compare choices (options, improve approaches, etc.) relative to criteria such as cost, ease of implementation, resources, effort, etc. This tool forces a team to focus on the best things to do, not everything they could do, dramatically increasing the chances for implementation success. Improve – Prioritize Solutions
Improve Phase: Prioritize Solutions - Prioritization Matrix Basic guidelines for a prioritization matrix: Virtually any criteria or factor can be used for ranking the options Effort (resources, costs) vs. Impact is a common matrix format for ranking potential improvement activities A cause and effect matrix is a form of a prioritization matrix All team members should come to consensus on the ranking of each option Improve – Prioritize Solutions
Sample Prioritization Matrix:Lean Pharmacy Impact for Pharmacy Complexity / Amount of Work Required Improve – Prioritize Solutions
Generate and Prioritize Solutions-Summary • Brainstorming • Affinity Diagrams (using key xs) • Process Mapping (current v. future) • Best practices/benchmarking • Prioritization
Improve Phase: Risk Assessment Even your solutions may have potential flaws or gaps at which they could break down. You will need multiple participants with different perspectives in this process to identify the potential problems and possible modifications to create the most robust improvement solution with minimized risk. The two techniques for assessing risk that we will focus on are: Force Field Analysis (FFA) Failure Mode and Effect Analysis (FMEA) Improve – Assess Risks