
0.38
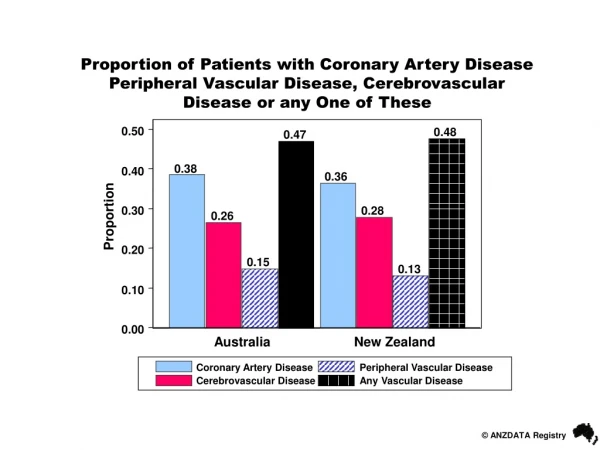
Proportion of Patients with Coronary Artery Disease Peripheral Vascular Disease, Cerebrovascular Disease or any One of These. 0.50. 0.48. 0.47. 0.38. 0.40. 0.36. 0.30. 0.28. Proportion. 0.26. 0.20. 0.15. 0.13. 0.10. 0.00. Australia. New Zealand. Coronary Artery Disease.

0.38
E N D
Presentation Transcript
Proportion of Patients with Coronary Artery Disease Peripheral Vascular Disease, Cerebrovascular Disease or any One of These 0.50 0.48 0.47 0.38 0.40 0.36 0.30 0.28 Proportion 0.26 0.20 0.15 0.13 0.10 0.00 Australia New Zealand Coronary Artery Disease Peripheral Vascular Disease Cerebrovascular Disease Any Vascular Disease
Age Distribution of Patients Receiving Dialysis According to Baseline CVD Status Age % No CVD Aus NZ 97% 96% 15-24 89% 89% 25-34 79% 77% 35-44 64% 55% 45-54 46% 41% 55-64 34% 33% 65-74 30% 30% 75-84 36% 50% >=85 3000 2000 1000 0 0 1000 2000 3000 Number without CVD Number with CVD Australia New Zealand
20 600 A B 400 15 10 200 100 5 Mortality per year SMR 50 20 2 10 1 5 35-44 45-54 55-64 65-74 75-84 35-44 45-54 55-64 65-74 75-84 Age Age No CVD CVD All Australian Patients Stratified by the Presence of Clinically Evident CVD Upon Starting Dialysis
15 A 10 5 Mortality per year 2 1 35-44 45-54 55-64 65-74 75-84 Age Australian Patients Without Clinically EvidentCVD Stratified by the Presence of Diabetes 400 B 200 100 50 SMR 20 10 5 35-44 45-54 55-64 65-74 75-84 Age No Diabetes Diabetes
15 300 A B 200 10 100 5 50 Mortality per year SMR 20 2 10 5 1 35-44 45-54 55-64 65-74 75-84 35-44 45-54 55-64 65-74 75-84 Age Age Female Male Australian Patients Without Clinically Evident CVD Stratified by Gender
5 A B 8000 6000 4 4000 3 2000 1000 Mortality per year 2 SMR 500 200 1 100 50 35-44 45-54 55-64 65-74 75-84 35-44 45-54 55-64 65-74 75-84 Age Age No CVD CVD All Sudden Cardiac Deaths in Australian Patients Stratified by the Presence of Clinically Evident CVD
A B 3 20 15 2 Deaths per 100 person years Deaths per 100 person years 10 1 5 0 0 1992 1995 1998 2001 1992-1994 1995-1997 1998-2000 2001-2003 Year Era 35-44y 45-54y 55-64y 65-74y 75-84y Cardiovascular Mortality Rates From 1992 - 2003 in the General Australian Population and Dialysis Population (A) The General Australian Population (B) Australian patients commencing dialysis between 1992 and 2002
20 A 15 10 Mortality per year 5 35-44 45-54 55-64 65-74 75-84 Age New Zealand Patients Stratified by the Presence of Clinically evident CVD Upon Starting Dialysis 500 B 400 300 200 100 SMR 35-44 45-54 55-64 65-74 75-84 Age No CVD CVD All