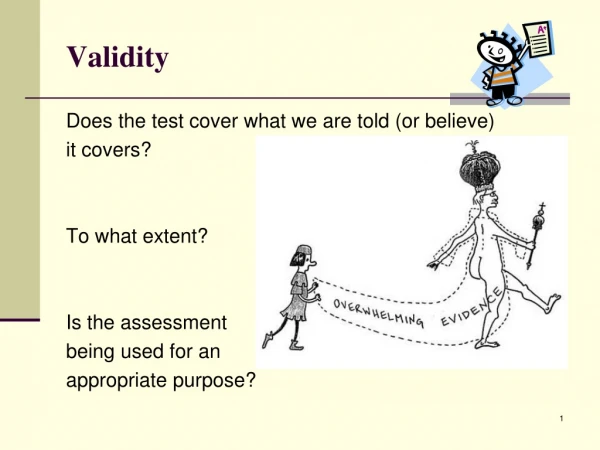

Validity
E N D
Presentation Transcript
1. Validity/Reliability
2. Reliability �
From the perspective of classical test theory, an examinee's obtained test score (X) is composed of two components, a true score component (T) and an error component (E):
�
X=T+E
�
3. Reliability The true score component reflects the examinee's status with regard to the attribute that is measured by the test, while the error component represents measurement error.
Measurement error is random error. It is due to factors that are irrelevant to what is being measured by the test and that have an unpredictable (unsystematic) effect on an examinee's test score.
4. Reliability The score you obtain on a test is likely to be due both to the knowledge you have about the topics addressed by exam items (T) and the effects of random factors (E) such as the way test items are written, any alterations in anxiety, attention, or motivation you experience while taking the test, and the accuracy of your "educated guesses."
�
5. Reliability Whenever we administer a test to examinees, we would like to know how much of their scores reflects "truth" and how much reflects error. It is a measure of reliability that provides us with an estimate of the proportion of variability in examinees' obtained scores that is due to true differences among examinees on the attribute(s) measured by the test.
6. Reliability
When a test is reliable, it provides dependable, consistent results and, for this reason, the term consistency is often given as a synonym for reliability (e.g., Anastasi, 1988).
Consistency = Reliability
7. The Reliability Coefficient
�Ideally, a test's reliability would be calculated by dividing true score variance by the obtained (total) variance to derive a reliability index. This index would indicate the proportion of observed variability in test scores that reflects true score variability.
True Score Variance/Total Variance = Reliability Index
8. The Reliability Coefficient A test's true score variance is not known, however, and reliability must be estimated rather than calculated directly.
There are several ways to estimate a test's reliability. Each involves assessing the consistency of an examinee's scores over time, across different content samples, or across different scorers.
The common assumption for each of these reliability techniques that consistent variability is true score variability, while variability that is inconsistent reflects random error.
9. The Reliability Coefficient
Most methods for estimating reliability produce a reliability coefficient, which is a correlation coefficient that ranges in value from 0.0 to + 1.0. When a test's reliability coefficient is 0.0, this means that all variability in obtained test scores is due to measurement error. Conversely, when a test's reliability coefficient is + 1.0, this indicates that all variability in scores reflects true score variability.
10. The Reliability Coefficient The reliability coefficient is symbolized with the letter "r" and a subscript that contains two of the same letters or numbers (e.g., ''rxx'').
The subscript indicates that the correlation coefficient was calculated by correlating a test with itself rather than with some other measure.
11. The Reliability Coefficient Regardless of the method used to calculate a reliability coefficient, the coefficient is interpreted directly as the proportion of variability in obtained test scores that reflects true score variability. For example, as depicted in Figure 1, a reliability coefficient of .84 indicates that 84% of variability in scores is due to true score differences among examinees, while the remaining 16% (1.00 - .84) is due to measurement error. � �Figure 1. Proportion of variability in test scores