
Uploaded by
sasson
1 SLIDES
210 VUES
20LIKES
EXIT SLIP!
DESCRIPTION
EXIT SLIP!. Mrs. Whitesides took a survey of ten 6 th grade students during Earth Week. She asked each student how many items they recycle in a day. Below are her results. 0, 0, 0, 1, 2, 2, 2, 3, 3, 5 Make a dot plot to display this data. What was the average amount of items recycled?
Download
1 / 1
Télécharger la présentation 
EXIT SLIP!
An Image/Link below is provided (as is) to download presentation
Download Policy: Content on the Website is provided to you AS IS for your information and personal use and may not be sold / licensed / shared on other websites without getting consent from its author.
Content is provided to you AS IS for your information and personal use only.
Download presentation by click this link.
While downloading, if for some reason you are not able to download a presentation, the publisher may have deleted the file from their server.
During download, if you can't get a presentation, the file might be deleted by the publisher.
E N D
Presentation Transcript
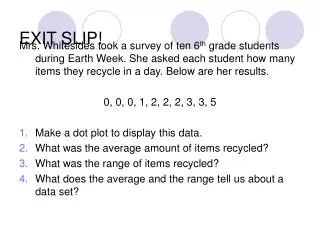
EXIT SLIP! Mrs. Whitesides took a survey of ten 6th grade students during Earth Week. She asked each student how many items they recycle in a day. Below are her results. 0, 0, 0, 1, 2, 2, 2, 3, 3, 5 Make a dot plot to display this data. What was the average amount of items recycled? What was the range of items recycled? What does the average and the range tell us about a data set?


More Related